Over the past two decades, major epidemics (SARS, Zika, MERS and Ebola) and pandemics (H1N1 and COVID-19) have emerged with increasingly alarming regularity1,2,3. Although currently the world is grappling with the COVID-19 pandemic, the occurrence of the next wave of infectious disease outbreaks in the coming years is deemed inevitable, given the rise in population, urbanization and global travel and/or trade. In that regard, large-scale population screening is the primary safeguard to contain epidemics, prevent pandemics and mitigate their human and economic costs on their onset4,5,6.
Accordingly, increasing our viral diagnostic and surveillance testing capacity globally is fundamental to our epidemic and pandemic preparedness7,8,9. Among the test options, nucleic acid amplification tests (NAATs) are advantageous over the antigen-based and antibody-based counterparts, owing to their superior sensitivity, specificity and ability for rapid deployment without the need to generate specific diagnostic antibodies10,11. To perform NAATs at large scale and frequency, accessible automated testing platforms are required that can be deployed in decentralized settings to analyse samples with high throughput, fast turnaround time and minimal capital cost and/or reagent use12,13,14. In particular, the strategic pooling of samples15,16,17,18, when most patients are expected to be negative, can lead to a marked reduction in resource utilization amid pandemic-induced supply chain disruptions (outweighing the marginal risk of dilution-induced false negatives19,20). Accordingly, flexible testing workflows dictated by adaptive pooling algorithms—such as viral prevalence-based algorithms—that are intended to maximize the screening efficiency are needed (Fig. 1a,b).
Fig. 1: Overview of the bioanalytical swarm ferrobotic platform for accessible, adaptable and automated viral testing.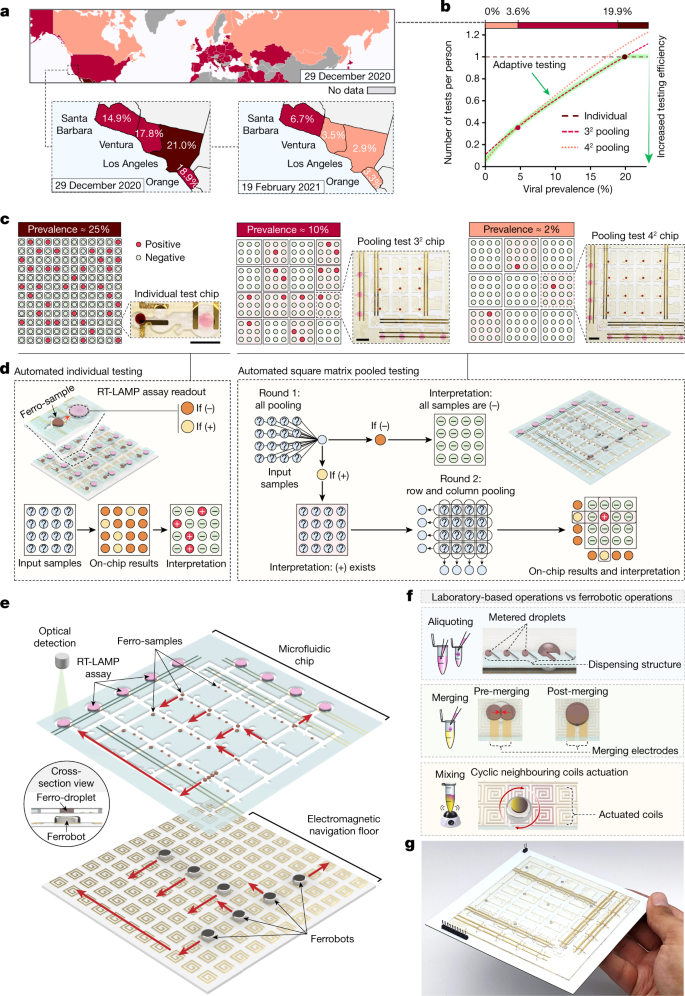
a, Spatiotemporal varying COVID-19 viral prevalence (based on the test positivity rate data from Our World in Data and California Health and Human Services Open Data Portal). Map generated using Visme. b, The required number of tests per person to find all infected people (across different levels of local viral prevalence), based on the square matrix pooled testing strategy. The green-highlighted curve illustrates that maximal screening efficiency can be achieved via adaptive (prevalence-based) testing. c, Optimal testing modes and the associated ferrobotic chips (scale bar, 1 cm) for the representative local viral prevalence levels of 25%, 10% and 2%. d, Overview of the automated workflows for individual and pooled testing of 16 samples. e, Exploded schematic of a representative ferrobotic viral testing platform (for example, 42 pooling). Red arrows, direction of the motion of the ferrobots and droplets. f, The ferrobotic equivalents of laboratory-based NAAT liquid handling operations, including aliquoting, merging and mixing. g, Optical image of a representative ferrobotic viral testing platform for 42 pooled testing.
However, current automated NAAT-based testing platforms are unable to perform the integrated liquid handling, analysis and automated feedback processes that are necessary to achieve these flexible workflows21,22,23. In addition, they use bulky, expensive and reagent-wasteful robotic liquid handlers and bioinstruments, with heavy installations and maintenance needs, and thus, they are restricted to centralized laboratory settings24,25,26,27,28,29.
To enable adaptive pooled testing, here we created an automated NAAT-based testing platform, which performs programmable liquid handling and bioanalytical operations within flexible workflows and in a parallel manner. Instead of resource-intensive and functionally limited robotic liquid handlers, we used a swarm of individually addressable millimetre-sized magnets as mobile robotic agents (‘ferrobots’) that can manipulate magnetic nanoparticle-spiked droplets (‘ferro-droplets’) with high precision and robustness. The seamless integration of fluidware, hardware and software allowed for programming and streamlining the droplet-based operations, and delivering versatile automated NAAT-centred workflows within a compact platform (for example, here we implemented reverse transcription loop-mediated isothermal amplification (RT-LAMP)). To maximize the screening efficiency, we formulated a prevalence-based adaptive testing algorithm (Fig. 1b and Supplementary Note 1). This algorithm particularly determines the optimal testing mode and guides the operational workflow in accordance with a square matrix pooling scheme (Fig. 1c,d), without entailing overly burdensome sample handling procedures. Adopting this approach over the fixed individual testing approach (universally pursued) allows for substantial savings over a wide viral prevalence range.
Figure 1e–g illustrates a representative ferrobotic testing platform, which consists of two modules (entirely constructed by low-cost components): (1) a disposable oil-filled microfluidic chip with passive and active actuation interfaces that hosts input samples and ferrofluid or assay reagents, and (2) a printed circuit board (PCB), featuring 2D arrayed coils (‘navigation floor’), which can be independently activated to electromagnetically direct individual ferrobots.
We realized the miniaturized bioanalytical operations and workflows within the framework of ferrobotics, because it simultaneously offers high degrees of robustness, diversity, programmability and scalability for low-volume sample handling. Within this framework, we developed and characterized a suite of operations, including droplet transportation, aliquoting, merging, mixing and heating, which are key to the on-chip implementation of NAAT-based assays (Fig. 2 and Extended Data Fig. 1).
Fig. 2: Ferrobotic operations enable NAAT-based testing.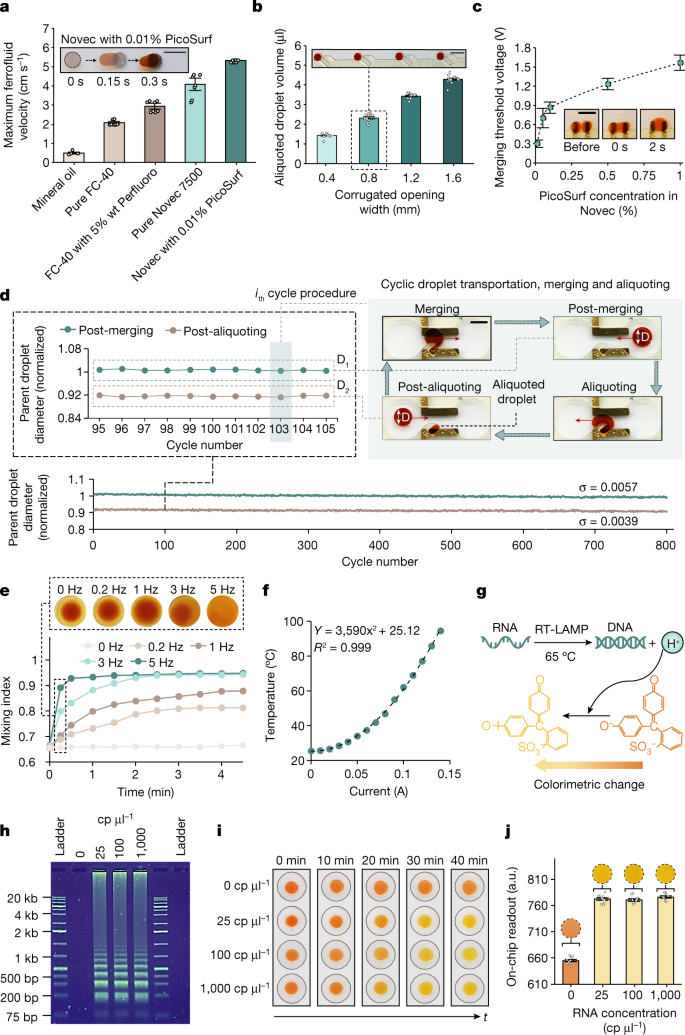
a, Characterization of the maximum ferro-droplet transportation velocity within different oil environments. The inset shows overlaid sequential images, visualizing the transportation process (scale bar, 3 mm). Error bars indicate mean ± s.e. (n = 4 independent experiments). b, Characterization of the aliquoted droplet size for different corrugated opening widths (channel height of approximately 900 μm). The inset shows that multiple aliquots of the same ferro-droplet source can be produced by extending the corrugated feature in an array format (scale bar, 5 mm). Error bars indicate mean ± s.e. (n = 12 across 3 replicates). c, Characterization of the threshold voltage for droplet merging using different concentrations of a surfactant (PicoSurf) within an oil (Novec) environment. The inset shows sequential optical images of the merging process (scale bar, 5 mm). Error bars indicate mean ± s.e. (n = 3 independent experiments). d, Characterization of the cyclic ferrobotic operations, involving aliquoting, merging and intermediate transportation of a parent droplet to evaluate the robustness of the ferrobotic operations (performed for more than 800 cycles; scale bar, 3 mm). Parent droplet size varied by less than 1% for each of the post-merging and post-aliquoting states (characterized optically). e, Progressive mixing index for different actuation frequencies. Corresponding images of the merged droplets under mixing at different actuation frequencies for 15 s are also shown (top). f, Characterization of the local temperature set by an on-board resistive heater for different input current. g, The RT-LAMP reaction and detection mechanism. h, Representative gel electrophoresis analysis of the RT-LAMP reaction product (repeated three times; reaction period of 30 min). i,j, Sequential optical images (i) and on-chip readouts (j) of the RT-LAMP assay performed in ferro-droplets containing negative control and spiked SARS-CoV-2-positive control RNA (25, 100 and 1,000 cp μl−1) samples. Error bars indicate mean ± s.e. (n = 10 independent optical sensor readouts).
By programming the underlying PCB-based coils, we electromagnetically directed the ferrobots to carry ferro-droplets within different oil environments, in which rapid droplet transportation with a maximum velocity range of 5–50 mm s−1 was achieved (Fig. 2a and Extended Data Fig. 1b). We found that Novec (oil)–PicoSurf (surfactant) yielded the maximum ferro-droplet speed (owing to its low viscosity; Supplementary Note 2, Supplementary Table 5 and Supplementary Fig. 6), as well as being compatible with the RT-LAMP assay.
Figure 2b illustrates the precise and tuneable ferrobotic sample aliquoting capability in the optimized Novec oil environment. In our context, aliquoting is a critical step for precise sample metering and creating sub-samples for multiplexing and multiround pooling analysis. Aliquoting is achieved by directing a ferrobot carrying a ferro-droplet along a corrugated structural feature, which in turn causes the dispensing of a smaller ferro-droplet (as an aliquot). By adjusting the corrugation opening and/or the channel height, the volume of the aliquot could be tuned over two orders of magnitude (for example, here 100 nl to 10 μl; Extended Data Figs. 1c,d and 2a).
To realize droplet merging, we utilized the principle of electrocoalescence. In our context, droplet merging is useful for adding reagents to the input samples and combining multiple input samples for pooling. As shown in Fig. 2c, by transporting the droplets to an electrode pair and applying a relatively low voltage (approximately 0.3–1.5 V, depending on the surrounding oil–surfactant composition; Supplementary Note 3 and Supplementary Fig. 7), droplet merging in less than a few seconds can be achieved.
We found that robust and repeatable ferrobotic droplet actuation can be achieved for droplets spanning different ionic strengths and chemical compositions relevant for biological and chemical assays (Extended Data Fig. 3). A total of more than 8 million actuation events were performed over more than 24 h (only limited by the observation time), showing repeatable behaviour over the time period. This behaviour differs from common digital microfluidics approaches such as electrowetting on dielectric, which undergo surface degradation-related issues30,31,32. Further illustrating that other ferrobotic operations are robust, we performed cyclic aliquoting, merging and intermediate transportation of a parent droplet over 800 cycles with less than 1% variation in the corresponding size of the parent droplet post-aliquoting and post-merging (Fig. 2d).
To realize mixing, which is particularly important for homogenizing the droplet contents post-merging, the ferrobot can be oscillated to induce chaotic fluid motion within the merged droplet by alternatively activating the neighbouring coils. As shown in Fig. 2e, the droplet homogenization rate increases with oscillation frequency and, in particular, a nearly full-mixed state can be reached in approximately 15 s by oscillating the ferrobot at 5 Hz.
We used on-board resistive heaters for nucleic acid amplification and sample preparation (for example, lysis). The local temperature can be controlled by adjusting the direct current flowing through the resistive heater, in accordance with the operational needs (Fig. 2f and Extended Data Fig. 4a–c).
We implemented a colorimetric RT-LAMP assay that is based on thermal lysis or inactivation21 and isothermal amplification (both achievable with on-board resistive heaters). This assay provides a high degree of test accessibility, outweighing the marginal compromise in test accuracy19,20. Figure 2g illustrates the RT-LAMP reactions, which involve reverse transcription of the viral RNA, amplification of the product DNA and generation of hydrogen ions, which are colorimetrically detected. By analysing the reaction product (DNA) via gel electrophoresis (Fig. 2h and Supplementary Fig. 1), we verified the assay function in converting and amplifying a SARS-CoV-2-positive control RNA sample. Colorimetric detection is based on the generated hydrogen ions, causing a colour change of an incorporated pH indicator (phenol red) from red-orange to yellow (optimization experiment results are shown in Extended Data Fig. 5a–c). The colour change allows for the binary interpretation of the test, above or below a threshold as positive or negative, respectively. This colour change can be tracked visually (Fig. 2i) by the naked eye, or electronically by integrating an optical sensor (Fig. 2j and Extended Data Fig. 4b,d), without the absorbance of the ferrofluid affecting the readout interpretations. Accordingly, the same limit of detection of 25 cp μl−1 of the adopted assay33 can be achieved in the ferro-droplet format (1 μl; reagent volume of 19 μl; similar to the original assay protocol), which suggests that the magnetic nanoparticles do not interfere with the amplification chemistry or colorimetric readout accuracy (Extended Data Fig. 5d). The assay was also successfully performed by using microfluidic structures of reduced height (approximately 150 μm) to aliquot a tenfold-smaller ferro-droplet volume (100 nl; reagent volume of 1.9 μl; Extended Data Fig. 5e), which is below the volume that can be accurately pipetted using robotic liquid handlers, but useful for minimizing reagent use. Our characterization results also verified the reliability of the assay in the presence of temperature variations of a few degrees Celsius (Supplementary Fig. 2a) and in the presence of biological interferents (Supplementary Fig. 3).
The programmability of our program (Supplementary Fig. 4) allows for its ease of adaptation to streamline the ferrobotic actuation and bioanalytical operations, and deliver versatile RT-LAMP-based testing workflows in an entirely automated manner and with high fidelity.
Illustrating this point in the context of individual sample testing, we customized a disposable microfluidic module to host the input sample, associated reagents and dedicated aliquoting or merging components (Fig. 3a and Extended Data Fig. 4b)—then, augmented it with a PCB module, containing the navigation coils, resistive heater elements and colorimetric sensing circuitry. By programming the PCB at the software level, we installed a ferrobotic instruction set to seamlessly execute the assay. The instruction set charts the navigation plan of a dedicated ferrobot and details the electrode excitation conditions for merging and heating, while accounting for a 5-min heat lysis and a 30-min RT-LAMP reaction period (Fig. 3b).
Fig. 3: Performance of an automated ferrobotic SARS-CoV-2 RT-LAMP workflow for individual clinical sample testing.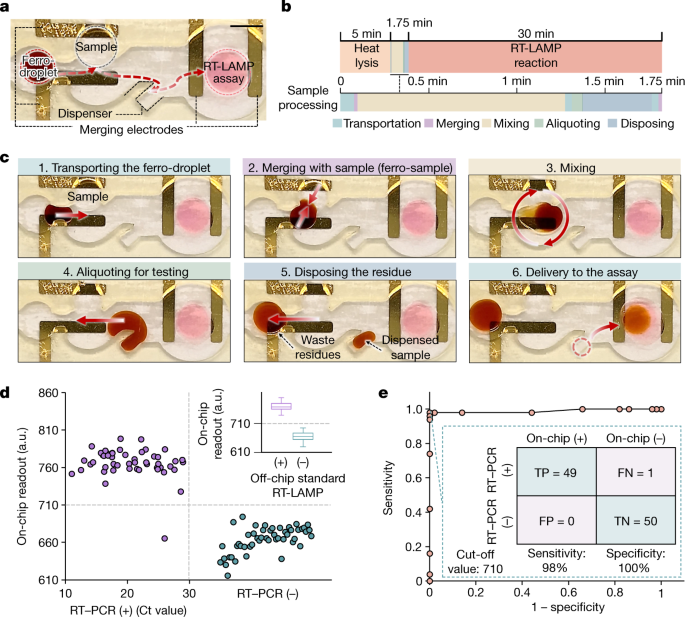
a, The microfluidic chip for individual sample testing (scale bar, 5 mm). b, The timeline of the streamlined on-chip operations for automated individual testing, which includes active ferrobotic sample processing operations over a time window of 1.75 min. Heat lysis and the RT-LAMP reaction were performed at 95 °C and 65 °C, respectively. c, Sequential optical images of the active ferrobotic sample processing operations (performed automatically). d, Comparison of the ferrobotic SARS-CoV-2 RT-LAMP assay readouts with the corresponding RT–PCR results (Ct values) for a collection of 100 clinical samples. Each datapoint represents one sample. The inset compares ferrobotically produced versus manually performed RT-LAMP assay results, illustrating that the corresponding sample test results are in complete agreement (whisker limits show extremums, box limits show quartiles and the horizontal line is the median, for the same collection of n = 100 samples). e, Corresponding receiver operating characteristic curve of the analysed samples. The sensitivity and specificity are based on the set cut-off value of 710 a.u. (also serving as the on-chip detection threshold). FN, false negative; FP, false positive; TN, true negative; TP, true positive.
In this testing workflow, the active ferrobotic operations take place over a period of 1.75 min (Fig. 3c and Supplementary Video 1). A ferro-droplet is first magnetically transported to, then merged and mixed with, an introduced sample droplet to make the sample amenable for ferrobotic manipulation. The next steps in the sequence are aliquoting the ferro-sample, disposing the ferro-sample residue and delivering the aliquot (1 μl) to the reaction chamber (containing the assay reagents). Upon delivery to the reaction chamber, the RT-LAMP process initiates, and after 30 min, the assay readout is colorimetrically quantified, rendering the test result in a sample-to-answer manner. A similar workflow was implemented using microfluidic chips with reduced height to achieve smaller ferro-droplets (approximately 100 nl) for analysis with reduced reagents (Extended Data Fig. 2b).
We assessed the accuracy of our platform with real-world samples by testing 100 clinical samples with the ferrobotic RT-LAMP chip and comparing the on-chip readouts with the corresponding readouts obtained from the standard PCR with reverse transcription (RT–PCR) and RT-LAMP assays (summarized in Fig. 3d and detailed in Supplementary Table 6). The collected samples were based on nasopharyngeal swabs from patients infected or uninfected with SARS-CoV-2. The viral on-chip detection threshold (710 a.u.) was derived from receiver operating characteristic analysis (aliquoted sample volume of 1 μl).
For all 100 samples, the ferrobotically produced results were in agreement with the manually performed (off-chip) RT-LAMP assay results (100% concordance), illustrating the high fidelity of the ferrobotic automation. Comparison of the ferrobotically produced RT-LAMP-based results with the corresponding results obtained from the RT–PCR assay (gold standard) resulted in a test sensitivity of 98% and specificity of 100% (Fig. 3e), in which the discrepancy in the rare test result can be attributed to the inherent differences of the amplification approaches used33. We further validated that the clinical samples with aliquoted volumes of 1 μl and 100 nl can be accurately analysed in a reproducible manner across replicates (Extended Data Fig. 6).
We next demonstrated multiplexed viral testing by utilizing the adaptability of our platform (Extended Data Fig. 7, Supplementary Video 2 and Supplementary Note 4). This testing mode is diagnostically useful for differentiating between the emergent outbreak virus (for example, SARS-CoV-2) and endemic viruses (for example, the seasonal viruses such as influenza A–H1N1) that often result in similar clinical symptoms34,35,36,37.
By utilizing the scalability of the platform, we can increase the testing throughput. The extensibility of the mobile robotic scheme used to a multi-agent mobile (swarm) robotic scheme, together with the expandability of the navigation floor or microfluidic architecture, inherently render our platform scalable. One approach to increasing the throughput is to simply extend our individual testing platform into an array format (Extended Data Fig. 4a,e). With this implementation, a large number of input samples can be analysed in parallel and asynchronously as they arrive—without involving accumulation wait time (unlike the case for current high-throughput methods that rely on batch processing38). A less trivial yet more efficient high-throughput testing approach involves applying our platform to the problem of adaptive pooled testing.
To determine the appropriate number of input samples and guide the pooled testing workflow, we utilized our prevalence-based adaptive testing algorithm that can be implemented following a square matrix pooling scheme. Following this approach, testing efficiency can be substantially improved in moderate-to-low viral prevalence ranges (specifically, by appropriately performing 32 or 42 matrix pooling, determined algorithmically; Supplementary Note 1).
Figure 4a provides an overview of the algorithm-guided square matrix pooling scheme, particularly for the case of 42 pooling, which involves a group of 16 samples arranged in a 4 × 4 matrix (Sij; i,j represent the row and column indices, respectively). In this scheme, all of the samples are first pooled together and the resultant sample aggregate is analysed by a single assay ‘A’. If the assay readout is negative, all of the original input samples will be deemed negative. Otherwise, a second round of testing will be followed. In this round, the samples will be pooled along rows and columns, leading to a total of eight sample aggregates. The row-pooled and column-pooled sample aggregates will be correspondingly analysed by dedicated ‘Ri’ and ‘Cj’ assays. The intersectional analysis of the Ri and Cj assay readouts allows for determining the infected sample (or samples) (Fig. 1d and Supplementary Fig. 5). In the relatively low probable cases (for example, 2.5%, assuming a viral prevalence of 2%) in which the paired row–column projections are not one-to-one mapped to specific arrangements of multiple positive samples, only those samples that are deemed suspicious (that is, those located at the intersection of positive row–column projections) will be individually tested.
Fig. 4: Performing a pooled SARS-CoV-2 RT-LAMP workflow using a ferrobot swarm.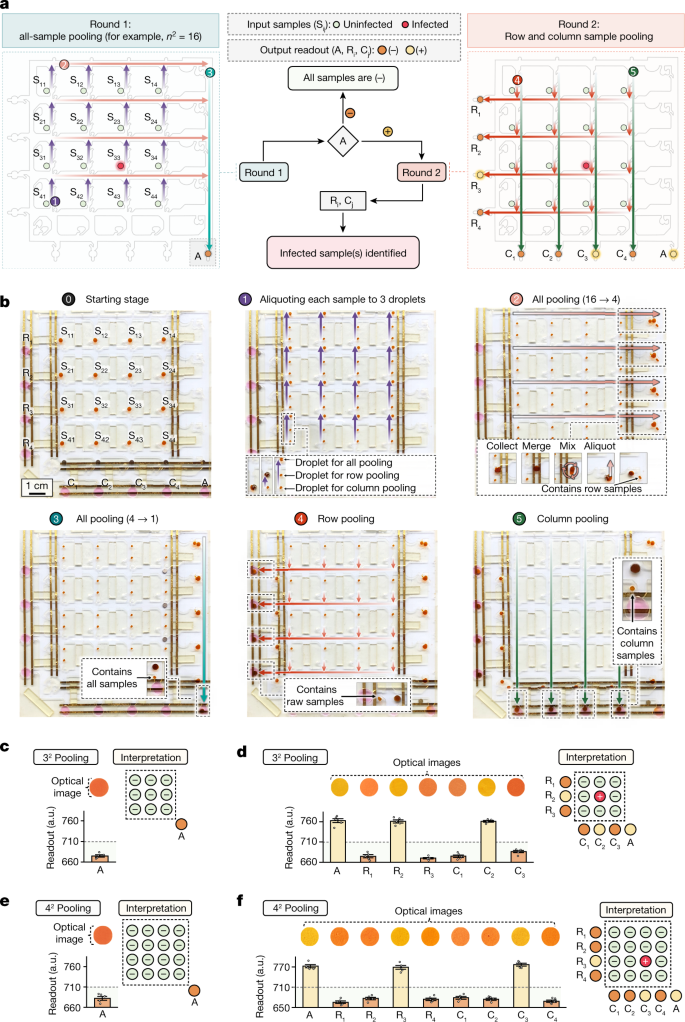
a, Schematic of the square matrix pooling scheme. The flow chart at the centre provides an overview of the infected sample identification process based on the assay pooled (A) or row–column (Ri/Cj) responses. b, Sequential optical images of an automated 42 pooling workflow performed by a team of nine ferrobots. To combine aliquots in each pooling step, they were ferrobotically collected, merged, mixed and then dispensed as a 1-μl droplet. The inset images show the critical intermediary ferrobotic operations. c,d, Optical images and readouts obtained from ferrobotic pooled testing of two groups of nine clinical samples using the 32 pooling chip. The negative assay A response indicated that no infected sample was present among the first group of samples in c. The positive assay A response along with the positive assay R2 and C2 responses led to the identification of the infected sample (located at the second row–second column) among the second group of samples (d). e,f, Optical images and readouts obtained from ferrobotic pooled testing of two groups of 16 clinical samples using the 42 pooling chip. The negative assay A response indicated that no infected sample was present among the first group of samples in e. The positive assay A response along with the positive assay R3 and C3 responses led to the identification of the infected sample (located at the third row–third column) among the second group of samples (f). In c–f, error bars indicate different trials of optical reading, mean ± s.e. (n = 5). Horizontal dashed line indicates on-chip detection threshold (710 a.u.).
To implement the square matrix pooled testing workflow, we expanded the microfluidic chip layout for pooled testing. Extended Data Figure 8a,b illustrates the corresponding layouts of the 32 and 42 microfluidic chips. The expanded layouts especially include arrays of sample aliquoting interfaces and reaction chambers (containing SARS-CoV-2 RT-LAMP assay solutions), orthogonal corridors for intrachip sample aliquot transport and extended merging interfaces. To direct the swarm ferrobotic operations in accordance with the devised pooling scheme, we utilized a PCB module with increased navigation coils (that is, an expanded navigation floor) and programmed the PCB module to install an updated multiferrobot-based and pooling algorithm-driven instruction set.
Figure 4b and Supplementary Video 3 illustrate the sequence of the operations performed by a swarm of nine ferrobots to deliver a representative 42 pooled testing workflow. The demonstrated sequence involves: (1) making three aliquots of each input sample with the aid of four ferrobots; (2) all-sample pooling to facilitate the first round of testing (performed in two steps; combining the aliquots on the same row using four ferrobots in parallel, followed by combining the resultant aggregates using a single ferrobot); and (3) row–column pooling to facilitate the second round of testing (each performed by a set of four ferrobots). To combine the intended aliquots in each of the pooling steps, the aliquots were ferrobotically collected, merged, mixed and then dispensed as a droplet with a metered volume (1 μl). The overview of the navigation plan and the detailed timeline of the task sequence executed by each ferrobot (in coordination with the other ferrobots) are shown in Extended Data Fig. 8c–f.
Before applying the scaled platform for pooled testing of clinical samples, we evaluated the dilutive effect of sample pooling on the assay detection capability (using positive nasal swab samples). The results indicated the capability of the assay in correctly identifying positive samples with a relatively low viral load, even at dilutions as high as 16 times (Extended Data Fig. 9).
We examined the pooled testing capability of the scaled platform by analysing a collection of 50 clinical samples (pre-characterized via RT–PCR). These samples were grouped in two arrangements of 9 and 16 samples and tested with the corresponding 32 and 42 chips in a way to allow for evaluating the pooling, detection and interpretation capabilities of the platform in the first and second rounds of testing. Specifically, for each group size or chip, we tested the scenarios that involved the absence or the presence of an infected sample. Figure 4c–f illustrates the corresponding on-chip optical characterization results (with assay reagent volumes of 19 µl to analyse aliquoted samples with volumes of 1 µl). Following the aforementioned testing scheme, by comparing the corresponding assay responses (all-pooled (A) or row–column-pooled (Ri/Cj)) with respect to their detection threshold, we determined the status of each sample. We performed similar pooled testing studies using smaller aliquoted samples (100 nl, with assay reagent volumes of 1.9 µl), demonstrating the ability to reduce reagents further (Extended Data Fig. 10). For all tested scenarios and across all samples, the ferrobotically produced and/or interpreted results were in line with those obtained by RT–PCR.
The demonstrated pooled-testing application, and scale of microfluidic liquid handling operations, is unprecedented. Supplementary Table 1 provides a detailed account of the number of droplet actuation and ferrobotic operations that were reliably carried out to achieve pooled testing. This was achieved by harnessing the competitive advantages of the ferrobotic technology that overcomes performance limits (in terms of reliability, scalability, reagent use and portability, among others) and cost barriers of alternative microfluidics approaches (Supplementary Note 5).
Depending on the situational needs, the ferrobotic testing platform can be adapted—with minimal reconfiguration—to automate other NAAT-based assays (for example, RT–PCR) as well as other pooling schemes (for example, Dorfman39). The ferrobotic testing platform can be constructed with low-cost consumables (Supplementary Table 2) and instrumentation (Supplementary Table 3) using widely available materials and circuit components and following existing scalable manufacturing solutions—together enabling mass production for rapid large-scale deployment. As summarized in Supplementary Table 4, we estimate that translating this platform for population-level screening can ultimately lead to approximately three orders of magnitude of increase in marginal gain in testing capacity from the instrumentation investment standpoint, and a 60–300-fold reduction in reagent costs at moderate-to-low viral prevalence (approximately 8% to 0.8%) and tenfold reduction at high viral prevalence. Accordingly, utilizing its high level of accessibility, adaptability and automation, the presented technology can be deployed as a democratized, distributed and decentralized solution to expand our testing capacity for pandemic preparedness. Beyond viral testing, the presented swarm ferrobotic technology can be adapted and scaled to efficiently streamline and massively parallelize various other laboratory-based bioanalytical operations within a miniaturized footprint (Supplementary Note 6). Thus, this technology can serve as a powerful tool for a wide range of biomedical and biotechnological applications such as diagnostics, omics, drug development and chemical and/or biomaterial synthesis.
Source: news.google.com