Overview of the multi-omics microsampling approach
The blood microsampling and multi-omics data acquisition workflow are shown in Fig. 1a. After testing numerous methods, we settled on collecting 10 μl blood microsamples using a Mitra device, a solid matrix that collects fixed blood volumes. We tested a wide variety of extraction conditions and further developed a method for efficiently extracting proteins, a broad range of lipids, and metabolites from a single microsample using biphasic extraction with methyl tert-butyl ether (MTBE). This extraction procedure yields an organic phase containing hydrophobic metabolites and lipids, an aqueous phase containing hydrophilic metabolites and a methanol-precipitated protein pellet processed for proteomics data acquisition. Using a separate microsample, we performed an aqueous extraction for performing multiplexed immunoassays on the Luminex platform (Methods). Omics datasets were then processed, annotated and curated for detailed omics analysis.
Fig. 1: Overview of the microsampling multi-omics workflow and stability analysis.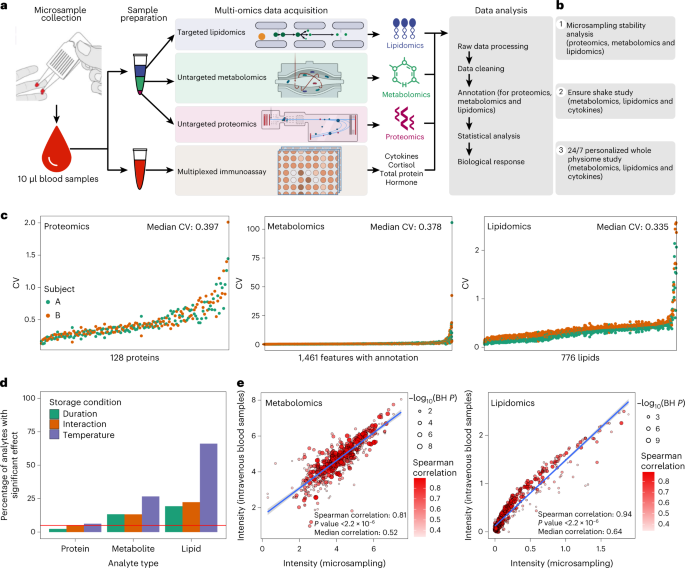
a, The samples were collected using microsampling devices, and then multi-omics data (proteomics, metabolomics, lipidomics, cytokine and so on) were acquired. b, Outline of the primary microsampling analyses. c, The coefficient of variation (CV) distribution for proteins, metabolites and lipids across all the samples in the stability analysis. d, The percentage of analytes is significantly affected by storage duration, temperature and interactions (linear regression). The red line shows the expected proportion of nominally significant results at the alpha level of 5% (P = 0.05). e, The Spearman correlations between microsamples and intravenous blood samples (n = 34) for metabolites and lipids, respectively.
Source data
To evaluate the microsampling method, we first examined the stability of proteins, metabolites and lipids in microsamples under multiple conditions, including testing storage duration and temperature (Fig. 1b and Extended Data Fig. 1a). We then compared microsampling with conventional intravenous sampling methods (Fig. 1b). Finally, two pilot case studies were performed to demonstrate how microsampling can capture important health and biological perturbations in a lifestyle context (Fig. 1b).
Protein, metabolite and lipid stability in microsamples in multiple conditions
We first evaluated the stability of proteins, metabolites and lipids in the blood microsamples (Supplementary Fig. 1). In brief, blood samples were collected from two participants using the 10 μl Mitra devices. A total of 36 microsamples were collected from each participant, with the microsamples stored in duplicate at three temperatures (4, 25 and 37 °C) and for five durations at each temperature (3, 6, 24, 72 and 120 h) before storage at −80 °C until analysis. An additional set of samples was immediately stored at −80 °C. Proteomics, metabolomics and lipidomics data were acquired from the microsamples (Methods). After quality control (QC), imputation and annotation of the data, there were 66 proteomics samples with 128 proteins, 71 metabolomics samples with 1,461 annotated features and 72 lipidomics samples with 776 lipids (Supplementary Dataset 1). Each omics dataset was assessed individually to examine analyte stability concerning storage duration, storage temperature and the interaction of storage duration and temperature. The stability metrics assessed were (1) the average coefficient of variation (CV) across both participants’ samples (estimated using the formula for log-scale data12), (2) the presence of significant effects of storage conditions on analyte level using a linear regression analysis (excluding the baseline samples that were not stored at any temperature) and (3) relative importance measures (partial R2 and the Lindeman, Merenda and Gold measure, LMG1; Methods).
The results revealed that, overall, the majority of analytes were quite stable to storage duration, temperature and the interaction effect (Fig. 1c,d). Proteins were the most stable (CV range 0.149–1.728, median 0.397) with few, that is, three (2.3%), eight (6.3%) and six (4.7%), associated with storage duration, temperature and the interaction effect, respectively. Metabolites were less stable (CV range 0.054–54.328, median 0.378) with 194 (13.3%), 389 (26.6%) and 193 (13.2%) associated with storage duration, temperature and the interaction effect, respectively. Finally, lipids were the least stable (CV range 0.088–2.218, median 0.335), with 150 (19.3%), 513 (66.1%) and 172 (22.1%) associated with storage duration, temperature and the interaction effect, respectively. The relative importance models gave similar results. Thus, most analytes can be reliably measured using remote sampling, and the less stable ones can be identified and potentially measured using correction models.
Comparison between microsample and intravenous plasma sample
We next examined the similarity between the molecular profiles derived from microsamples of whole blood compared with venepuncture plasma. Blood samples were collected from 34 participants using both microsampling and conventional intravenous blood draws (Supplementary Fig. 1a and Methods), and metabolomics and lipidomics data were acquired from each participant (Supplementary Dataset 2). The median intensity of every feature in the 34 participants was calculated separately in the two datasets, microsampling and intravenous plasma collection samples, and compared via correlation graphs (Fig. 1e). Interestingly, the results of the microsampling and intravenous collection methods were quite similar in that the Spearman correlations were 0.81 (P < 0.001) and 0.94 (P < 0.001) for 642 metabolites and 616 lipids, respectively. Metabolites and lipids that were not well correlated (Spearman correlation < 0.5) were enriched for amino acids and triglycerides (TAGs), respectively (Supplementary Fig. 1b,c). However, most classes of molecules were very similar between the microsampling and venous blood draw, including most of the amino acids, carbohydrates, free fatty acids (FFAs), TAGs, diglycerides, phosphatidylcholines (PCs) and other molecules.
Case studies
As a demonstration of the power of microsampling, we performed two case studies while participants were in their native environments. The first was to examine the effect of drinking a complex mixture on metabolic profiles. The second was to perform very dense ‘24/7’ profiling (98 microsamples) across a period of just longer than 7 days.
Case study 1: metabolic phenotyping responses to Ensure shake consumption
Individuals can differ markedly in their metabolic response to food on the basis of their epigenome, microbiome, metabolome and other factors13,14,15,16, yet the heterogeneity of this response is not well understood or fully established. Determining these differences at an individual level is important to optimize diet and lifestyle changes for personalized health, weight reduction and/or management of the metabolic disease. Biomarkers are typically measured at a single timepoint because of the difficulty of collecting high-frequency blood samples using a conventional blood sampling approach, but the rapid and dynamic nature of metabolism in response to food intake requires higher resolution. To follow the diversity of metabolic responses to complex dietary mixtures, we measured the multi-omics responses to a defined mix of carbohydrates, lipids, proteins and micronutrients. We analysed metabolomics, lipidomics, cytokines and hormones in 28 participants with diverse backgrounds (Fig. 2a and Supplementary Fig. 2a) and developed six metabolic responses metrics: (1) carbohydrate, (2) lipid, (3) amino acid (protein), (4) insulin secretion, (5) FFA (related to insulin sensitivity) and (6) immune (cytokines).
Fig. 2: The overview of Ensure shake study and molecular response to Ensure shake.
a, The study design and overview of the Ensure shake study. b, The summary of multi-omics data from the microsamples. c, Responses of metabolites, lipids and cytokines/hormones after Ensure shake consumption (two-sided Wilcoxon rank test). d, The clustering of dysregulated molecules following Ensure shake consumption. e, Amino acid response to Ensure shake consumption. f, Response of three dysregulated carbohydrates to Ensure shake consumption. g, Acylcarnitine response to Ensure shake consumption. h, Cytokine/hormone response to Ensure shake consumption. The points are represented by mean ± s.d.
Source data
Thirty-two participants were mailed a kit containing microsampling Mitra devices, an Ensure shake and careful instructions for microsampling sample collection. Each participant collected one microsample (defined as 0 min), consumed the Ensure shake and collected additional blood microsamples at 30, 60, 120 and 240 min after consumption (Fig. 2a). Participants returned their microsamples by overnight mail on the same day of microsample collection. The microsamples were used for multi-omics data acquisition, namely, metabolomics, lipidomics and cytokines/hormones. Four subjects without metabolomics data were removed from the dataset (Methods and Fig. 2b). After data cleaning, curation and annotation, 768 analytes were detected from the microsamples, including 560 metabolites, 155 lipids and 54 cytokines/hormones for each of the 28 participants at each of the five timepoints (a total of 140 data points) (Fig. 2b and Supplementary Dataset 3).
Clustering of altered molecules
We first determined whether the microsampled multi-omics data reflected the consumption of the Ensure shake. For each timepoint post consumption, the Wilcoxon rank test was used to define the significantly dysregulated molecules compared with timepoint 0 (baseline). Interestingly, the majority of significantly increased metabolites and lipids peaked at approximately 60 min and 120 min, respectively, and then approached baseline levels by 240 min (Fig. 2c). These results indicate that many molecules substantially responded to Ensure shake in the blood, and the response kinetics differed on the basis of the classes of molecules.
To quantify the molecules that shifted their levels upon Ensure shake consumption, an analysis of variance (ANOVA) test was used. The results show that the levels of 99 of 560 metabolites (17.7%, permutation test P < 0.001), 115 of 155 lipids (74.2%, permutation test P < 0.001) and 7 of 54 cytokines/hormones (13.0%, permutation test P < 0.001) significantly shifted following Ensure shake consumption (Supplementary Dataset 4 and Methods). For the metabolites whose levels changed, the signals of analytes that differed from baseline were greater than those affected by storage duration. These results demonstrate that multi-omics analysis from microsamples can be used to measure the metabolic response to Ensure shake.
The molecules significantly affected by Ensure shake were then clustered using fuzzy c-means clustering to reveal and summarize the pattern of changes associated with consumption time (Methods). The shifted molecules were grouped into three major clusters across five timepoints (Fig. 2d). Cluster 1 contained 39 metabolites, 1 lipid and 4 cytokines that increased and then decreased with a peak at approximately 60 min following Ensure shake consumption and then returned to baseline by 240 min. Cluster 2 contained 19 metabolites and 106 lipids that increased more gradually than cluster 1, peaking at approximately 60–120 min. Molecules in cluster 3 decreased after consuming the Ensure shake and then recovered, including 23 metabolites, 8 lipids and 3 cytokines (Fig. 2d). These results demonstrate that the molecules have different patterns and kinetics of the biochemical responses to complex mixture ingestion.
Altered metabolic pathway and physiological responses to Ensure shake
We next explored the pathways and physiological responses represented by the molecules in each cluster (Fig. 2d and Supplementary Fig. 2). Cluster 1 primarily comprised metabolites (39 metabolites, 1 lipid and 4 cytokines) and several biological pathways such as aminoacyl-tRNA biosynthesis, phenylalanine, tyrosine and tryptophan biosynthesis, and phenylalanine metabolism pathways were evident (Supplementary Fig. 2c). The two major chemical classes captured in cluster 1 were amino acids and carbohydrates (Fig. 2d). Both compound classes probably come directly from the Ensure shake or are metabolized quickly (Fig. 2e,f). On the other hand, for cluster 3, acetylcarnitine was the main metabolite class, which dramatically decreased upon Ensure shake consumption and then recovered gradually by 240 min (Fig. 2g). This is expected because acetylcarnitine is broken down in the blood by plasma esterases to carnitine, and carnitine helps FFAs to be transported into the mitochondria for β-oxidation and energy production, hence maintaining whole-body energy homeostasis17. Consistent with this interpretation, eight FFAs detected in cluster 3 (Supplementary Fig. 2d) decreased following Ensure shake consumption. Notably, in cluster 2, we found 106 lipid species (Fig. 2d), and most of them were TAGs (102 TAGs with 48–52 carbons chains and 1–3 unsaturations; Supplementary Fig. 2e).
To better understand the molecules in the Ensure shake that might be directly detected in the participants’ microsamples, we also analysed the composition of the Ensure shake using the same mass spectrometry procedure. Nearly 50% of the compounds found in the Ensure shake can be detected in the blood, and most of the remainder were of low abundance (Supplementary Fig. 2f). Importantly, of 21 high-interest metabolites that changed in the blood (Fig. 2e,f,g), 17 are present in the Ensure shake. This result demonstrates that the microsampling approach is able to detect the ingested molecular signatures from blood samples.
It is well known that both connecting peptide (C-peptide) and insulin are co-secreted from the pancreas and correlate with increased carbohydrates18,19,20. As expected, C-peptide and insulin were in the same cluster with the carbohydrates (cluster 1, Fig. 2h). Moreover, we found both gastric inhibitory polypeptide (GIP) and pancreatic polypeptide (PP) in the same cluster with insulin (cluster 1) (Fig. 2h, left). GIP is an inhibiting hormone of the secretin family of hormones21, and its main role is stimulating insulin secretion22. Increased secretion of PP is reported to be associated with protein meal consumption, fasting, exercise and acute hypoglycemia23. In cluster 3, we found that leptin, interferon-γ (IFNG) and interleukin 4 (IL4) decreased quickly following Ensure shake consumption (Fig. 2h, right). The primary function of leptin is regulating adipose tissue mass through central hypothalamus-mediated effects on hunger24; its levels are expected to decrease after food consumption. IFNG and IL4 are involved in immune responses, including allergies and antibacterial responses. Interestingly, this suggests that the Ensure shake may have anti-inflammatory properties. In summary, these results demonstrate that the kinetics of the biochemical responses, including hormones, to complex mixture ingestion can be revealed using microsampling (Supplementary Dataset 5).
Metabolic phenotyping reveals unique individual responses
How individuals respond to different foods is an area of great interest. The Ensure shake is a simple yet complex mixture of many types of simple molecules that can be quickly absorbed by the small intestine. To examine how different people respond to different metabolites, we explored the diversity in the kinetics and magnitude of the molecular responses among the different participants. Analysis of the samples using a t-distributed stochastic neighbour embedding (tSNE) plot shows that the samples were clustered by the participant, indicating that each participant had a unique molecular profile and that the difference between participants was greater than that of the effect of the shake (Extended Data Fig. 2a). Nonetheless, a clear timewise separation of data points was observed (Extended Data Fig. 2b). Our study suggested that, by 240 min, the metabolic levels tend to return closer to their baseline level (Extended Data Fig. 2b). We then used unsupervised consensus clustering to cluster participants into different groups. Our results suggested that there were two major groups based on the molecules altered in response to the shake consumption (Extended Data Fig. 2c and Methods). In those two groups, we calculated the level of changes in metabolic features, comparing each timepoint with the baseline (timepoint 0) for each participant (Methods). This result also suggested that participants of those two groups had different responses to the Ensure shake (Extended Data Fig. 2d): group 2 responded more slowly than the participants in group 1 (Extended Data Fig. 2d), indicating the kinetics of their responses were different. Interestingly, for the 13 individuals with a measure of insulin resistance (steady-state plasma glucose (SSPG; Methods)), although statistically insignificant, we noticed a trend for patients with insulin resistance to be included in group 1 over group 2 (Wilcoxon test: P = 0.29, Extended Data Fig. 2e).
Metabolic scores based on the dynamic response to the Ensure shake
As individuals are known to vary in their response to different foods, and we found heterogeneity in response to the Ensure shake for each participant, we next examined the response of each class of molecules, carbohydrates, lipids, cytokines/hormones and proteins to shake ingestion.
We derived a ‘metabolic score’ for the degree of an individual’s carbohydrate, lipid, FFA and protein response to the Ensure shake, along with insulin secretion and inflammatory response (cytokines) (Methods). Briefly, for each molecule in each participant, after the Ensure shake consumption, the area under the curve (AUC) was used to represent its cumulative value (Fig. 3a). The AUCs of molecules for each molecular class (lipids, carbohydrates, amino acids and inflammatory molecules) were then used to calculate the response score for each participant (Fig. 3b). The final metabolic scores were normalized and ranged from 0 to 1, where 0 means the lowest relative metabolic level and 1 means the highest relative metabolic level. One participant was recognized as an outlier subject and excluded during the score calculation (Supplementary Fig. 3 and Methods). For each participant, we observed a consistent distribution pattern of the molecular species within each metabolic score indicative of similar response patterns to Ensure shake consumption. However, those patterns differed greatly across subjects demonstrating high inter-individual variability in the metabolism of nutrients (Supplementary Figs. 4 and 5a).
Fig. 3: Metabolic phenotyping based on the multi-omics response to the Ensure shake.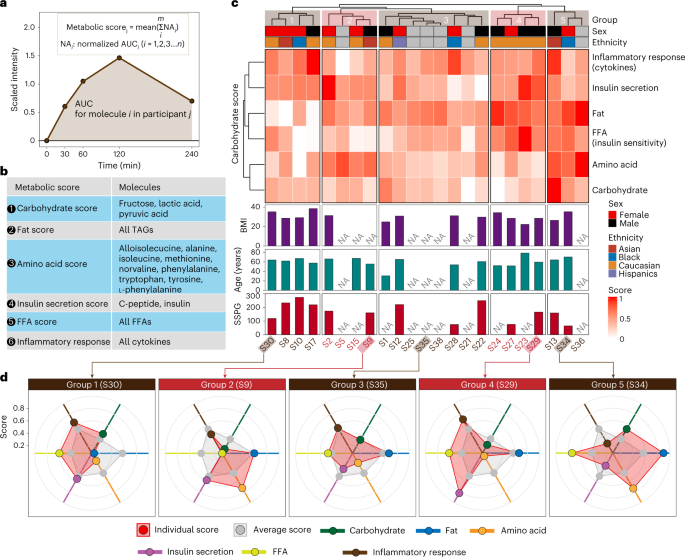
a, The visualization of the AUC metric for each analyte used in a metabolic score. b, The analytes used in calculating each of the six metabolic scores are shown. c, Participants were grouped into five groups on the basis of six metabolic scores. d, Five participant examples for each group.
Source data
The six metabolic scores were calculated for each participant. As expected, we found a negative correlation between FFA score and SSPG, a marker of insulin resistance25 (Supplementary Fig. 5b). Previous studies have demonstrated that elevated plasma levels of FFA are associated with insulin resistance26. The participants were classified into five groups on the basis of their metabolic scores using the hierarchical clustering method (Fig. 3c). We found that individuals varied considerably in their response to the shake for each of the different areas; examples selected from each of the five groups are shown in Fig. 3d. Within each group, we observed variations in the scores from the average score per metabolic class. For example, participant S30 in group 1 presented lower metabolic scores for fats and amino acids compared with the average level of the entire group. In comparison, S34 in group 5 showed higher scores for those classes (that is, carbohydrates and amino acids) than the average scores. These differences may be due to a variety of underlying mechanisms, including levels of digestive enzymes, transporters, hormones (such as incretins) and/or intestinal microbes required to process particular molecules in the Ensure shake. Such underlying causes can be investigated in the future through additional analyses (such as metabolic flux analysis). Interestingly, S29 and S35 in groups 3 and 5, respectively, had higher scores in hormones and cytokines. The latter is particularly interesting as some individuals appear to have a strong inflammatory response (for example, individual S35), whereas others have a different response to appetite-suppressing hormones. Thus, the multi-omics data from microsamples reveal the enormous heterogeneity in the biochemical responses of each individual to a complex mixture. Such information can be defined using microsampling and is important for precision nutrition diets, including inflammatory responses to food. Correlating these individual responses with medical phenotypes (for example, low-density lipoprotein levels and HbA1c levels) will be important for personalized nutrition management in the future.
Case study 2: 24/7 personalized whole physiome profiling using wearable and multi-omics data
Several studies have demonstrated that longitudinal individualized molecular profiles, clinical tests and digital data can monitor health and enable early disease detection at an individual level1,27,28,29. However, these studies use low-frequency/high-volume blood sampling (weekly or monthly, for instance), which does not enable the detection of detailed patterns such as circadian and many high-resolution lifestyle metabolic and other molecular changes. Higher-frequency data collection would enable monitoring of health status as well as circadian and lifestyle patterns at high resolution in real time, uncover relationships between molecules with each other and physiological and lifestyle activities and decipher causal associations between them at the personal level.
As a proof-of-principle study to determine whether this is feasible, we explored the combined use of our microsampling approach and wearables to explore the detailed molecular and physiological changes that occur in a real-world native context in a single individual. In this ‘24/7 study’, a single participant collected blood microsamples usually every 1–2 h during waking hours over 7 days, with some samplings as short as 30 min apart (Fig. 4a and Supplementary Fig. 6a). A total of 98 samples were collected over 7 days along with wearable data from two devices: (1) a smartwatch that recorded heart rate (HR) and step count, and (2) a continuous glucose monitor (CGM)30 (Fig. 4a, Supplementary Fig. 6b and Supplementary Dataset 6). Food logging was also performed many times each day using an app.
Fig. 4: Overview of the study design, sample collection and data acquisition for the 24/7 study.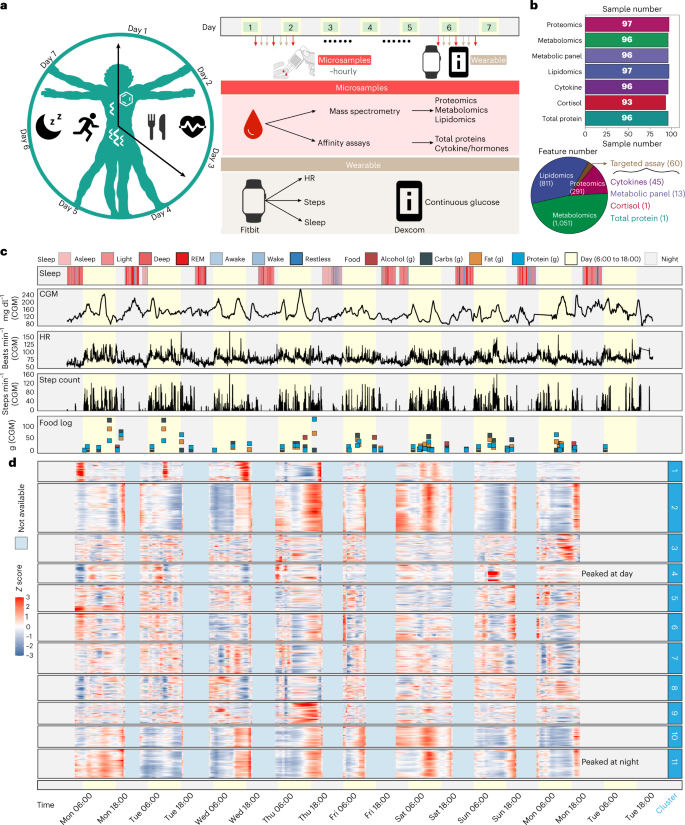
a, One participant was closely monitored using wearable devices and high-frequency microsampling (approximately hourly) across 7 days. Microsamples were then analysed for internal multi-omics data measurements. b, Molecular information was detected from the high-frequency microsamples. c, Wearable data from the smartwatch (sleep and step count) and Dexcom (CGM glucose). Legend defines the status of sleep (note that REM = rapid eye movement), the category of consumed foods, and the day/night period at every record. The yellow background represents the daytime (6:00 to 18:00). d, The internal molecules were grouped into 11 clusters using fuzzy c-means clustering.
The 98 microsamples were used for in-depth multi-omics profiling, including untargeted proteomics, untargeted metabolomics, targeted lipidomics and targeted cytokine, hormone, total protein and cortisol assays (Fig. 4b, top). After data acquisition and annotation, we detected a total of 2,213 analytes that included 1,051 metabolites, 811 lipids, 291 proteins, 45 cytokines, 13 metabolic panels (cytokines/hormones), 1 total protein and 1 cortisol measurement (Fig. 4b, bottom) resulting in a total of 214,661 biochemical measurements in addition to wearable physiological data (Supplementary Dataset 7). Overall, the prospective collection of internal molecular and wearable data resulted in comprehensive, high-frequency and abundant longitudinal data on the human whole physiome and lifestyle (Fig. 4b,c and Supplementary Fig. 6b,c), allowing us to explore how the internal molecules and physiology change on an hourly scale and their relationships at a personal level.
To explore whether multi-omics microsampling captures real biological signatures (such as food intake), we selected 2 days on which the participants ate high-carbohydrate food (131.8 g) and low-carbohydrate food (31.9 g), respectively (Supplementary Fig. 7a). Then the two carbohydrate metabolites (fructose and pyruvic acid) in microsamples were extracted and analysed, as shown in the box plot in Supplementary Fig. 7b. The median values of carbohydrate metabolites are 7.8 and 4.7, respectively, demonstrating that the omics data from microsamples roughly reflect the concentration of the food type the participants consumed.
Wearable and internal multi-omics data reflect the individual physiological status
We first explored whether wearable and high-frequency internal multi-omics data can monitor and reflect the participant’s health status and searched for general patterns in the data. The 2,213 internal molecular profiles were smoothed (Methods and Supplementary Fig. 7c,d) and then grouped into 11 clusters using fuzzy c-means clustering analysis (Fig. 4d and Extended Data Fig. 3a). Two clusters followed circadian patterns. For example, cluster 4, which is enriched by a high number of metabolites (Extended Data Fig. 3b), generally peaked during the day time, while cluster 11, which includes mostly lipids (Extended Data Fig. 3b), peaked primarily at night (Fig. 4d). Other clusters were not necessarily tied to circadian patterns and thus may reflect other events. The components of the different clusters were unique, indicating that the molecules have different temporal patterns (Extended Data Fig. 3b). To obtain tight and distinct molecular modules from each cluster, we used the community analysis method31 (Methods and Extended Data Fig. 3c–e). Interestingly, obvious peaks were found in some modules (Extended Data Fig. 3e,f and Methods), indicating that the molecules in modules may be triggered by specific events (Figs. 4d and 5a).
As we have the detailed food (nutrition) and exercise logs, we next analysed whether and how molecular fluctuations relate to daily nutrition intake32,33 (Methods). Briefly, nutrients in the food log were classified into several major classes on the basis of their content level: amino acids, vitamins, fat, electrolytes, calories, carbs and fibre. Next, we calculated the association between those classes with internal molecules presented by the Jaccard index depicted in the heat map (Extended Data Fig. 3g). Interestingly, we captured a high association between classes of amino acids and fat with several modules highly enriched in amino acids, FFAs and lipids (Extended Data Fig. 3g), consistent with previous results34. As with the Ensure shake study, our data revealed molecular associations with daily nutrition intake. For example, the participant consumed the same meal shake every morning during the study, and we captured a clear link between daily shake consumption and temporal increase of several compounds such as 1,2,3-benzenetriol sulfate and hydroxyphenyllactic acid, which are listed as the shake’s ingredients (Fig. 5a, top, and Extended Data Fig. 3h).
Fig. 5: Wearable and internal multi-omics data reflect the individual physiological status and circadian rhythm analysis of multi-omics data.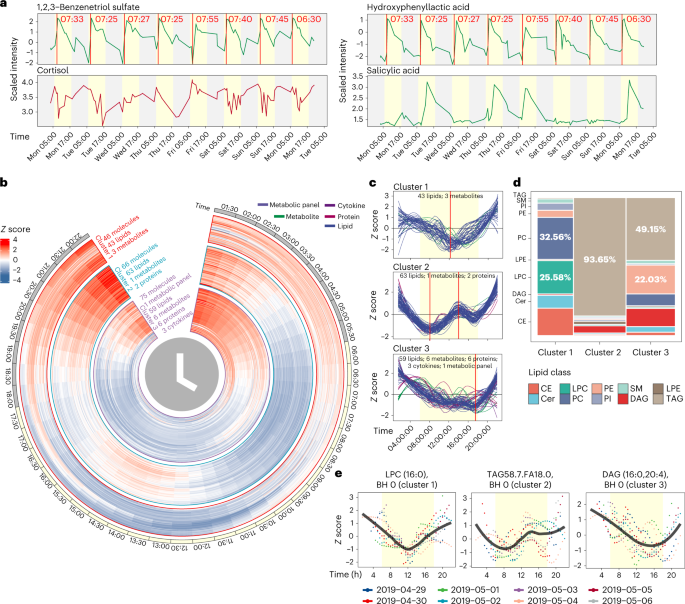
a, Four molecules reflect the participant’s lifestyle. b, Heatmap to show the rhythmic molecules. c, Three clusters that have strong rhythmic patterns. d, Lipid class distributions of lipids in three clusters. Cer: ceramide; SM: sphingomyelin; DAG: diacylglycerol; LPE: lysophosphatidylethanolamine. e, Examples for each cluster. The yellow background represents the daytime (6:00 to 18:00).
Source data
Cortisol is believed to follow a circadian pattern, with levels higher in the morning that decrease towards the evening35. However, events during the day related to stress, activity and diet can impact cortisol levels36. Although morning peak levels of cortisol were evident on 3 days, we observed large day-to-day variations in cortisol patterns, demonstrating that within-day cortisol levels may not represent accurate inter-day cortisol patterns for this individual (Fig. 5a). This result suggests the importance of high-frequency sampling for monitoring health marker status.
Importantly, this study also demonstrates the potential usage of microsamples to measure the pharmacokinetics of a drug at an individual level. Our participant took a low dose of aspirin in the morning for 4 days. Microsampling accurately captured the pharmacokinetics of salicylic acid (hydrolysed product of aspirin, Extended Data Fig. 3h) and revealed a clearance period of about 24 h in this person, which is similar to previous results37 (Fig. 5a, bottom). In addition, we found a negative correlation between caffeine and sleep quality (Extended Data Fig. 4a,b). This might be expected and has been reported in other studies38,39; however, the participant always consumed coffee before noon, indicating its long-lasting effect.
Interestingly, our detailed monitoring also revealed an unidentified inflammatory event in the middle of the week, spanning 3 days, with a number of both increased inflammatory cytokines (for example, TNFα and CD40L) and as well as several others that decreased (for example, eotaxin) (Extended Data Fig. 4c,d). This event was subclinical, as no symptoms were reported, and may represent an asymptomatic infection or other stress event. Together, these results show the power of high-frequency monitoring to record daily measures and health-related events not evident to the patient. The latter is particularly important for the early detection of disease40.
Circadian rhythms of internal molecules in human blood
Circadian rhythms are endogenous oscillators in physiological and behavioural processes over a 24 h cycle, and they play a critical role in human health and diseases41. Circadian molecules participate in diverse physiological phenomena such as cell division, energy metabolism and blood pressure36,42. These have not been explored at a personal level in a real-life setting because of the low frequency and high blood volume limitations of traditional blood sampling. Using the high-frequency data collected from the microsampling method, we were able to explore and evaluate molecules associated with circadian rhythms in the human body43.
Each molecule was first searched for those that exhibited a consistent pattern across all 7 days, and we removed those that lacked a consistent daily pattern (Methods and Extended Data Fig. 5a). The circadian rhythms analysis (JTK_CYCLE algorithm44) was then used for quantitative analysis of all the molecules (Methods). We identified 332 circadian molecules (Benjamini–Hochberg (BH)-adjusted P values < 0.05) that show clear circadian patterns (Extended Data Fig. 5b and Supplementary Dataset 8). The circadian molecules were grouped into five major clusters using fuzzy c-means clustering (Extended Data Fig. 5c). Interestingly, all clusters, except cluster 4 (enriched by protein), were dominated by lipids (Extended Data Fig. 5d). We focused on the molecules that exhibited a complete 1-day cycle (those in clusters 1, 2 and 3; Fig. 5b,c) and removed clusters 4 and 5, whose molecules had different levels at the beginning and end of the day (Extended Data Fig. 5e,f). Cluster 1 was dominated by PC (32.56%) and lysophosphatidylcholine (LPC, 25.58%), cluster 2 was dominated by TAGs (93.65%), and cluster 3 was dominated by both TAGs (49.15%) and phosphatidylethanolamine (PE, 22.03%) (Fig. 5d). Examples for each cluster are shown in Fig. 5e.
To explore the in-depth functions of the rhythmic molecules in each cluster, we performed lipid enrichment analysis using Lipid Mini-on45. LPC, PC, sterol and cholesterol ester (CE) were significantly enriched in cluster 1. Previous work has shown that LPC and PC have circadian rhythms with peak concentrations in the evening, consistent with our result46. For cluster 2, TAG and glycerolipid were significantly enriched, and for cluster 3, PE was significantly enriched (Extended Data Fig. 6). Thus, the different classes of lipids exhibit distinct circadian patterns. To explore whether the circadian lipids were affected by the food intake, we then examined the food logging data. We found that the fat nutrition intake differed across 8 days, meaning that the circadian lipids are not driven by the food intake. It is plausible that circadian lipids were driven by individual rhymic kinetics or gut microbes. In summary, multi-omics analyses from the high-frequency microsamples revealed rhythmic molecules and demonstrated that lipids related to energy metabolism have distinct circadian patterns.
Wearable data reflect internal molecular changes
Over the past several years, longitudinal monitoring of physiological data has garnered considerable interest30,47,48,49,50. However, the ability of wearable data to predict clinical labs has been limited30. Several studies have demonstrated that wearable data can reflect and predict the internal molecules (multi-omics data), including laboratory clinic tests and metabolites on a weekly or monthly scale29,30. However, due to the low-frequency sampling of multi-omics data, the circadian patterns and causal relationships between digital and internal molecular data cannot be discerned50. We explored the relationship between wearable data and internal molecular changes on an hourly scale at an individual level, including building predictive models.
Because of the different sampling frequencies of wearable and internal multi-omics data, we first attempted to match the wearable and internal multi-omics data using different window sizes. The matching windows were set as 5, 10, 20, 30, 40, 50, 60, 90 and 120 min. For each wearable data type (HR, step count and CGM) in the matched windows, a feature engineering pipeline30 was used to convert different data types into eight features (for example, the standard deviation (s.d.) of heart standard and maximum HR; Methods) resulting in a total of 24 wearable features. The 24 wearable features were used to predict each analyte using the random forest model. Of the 2,223 molecules, we found 447 molecules that correlated with wearable features with at least one R2 > 0.3 (Supplementary Fig. 8a). Interestingly, we also found that most molecules have higher prediction accuracy with the larger matching window, consistent with a previous study30. Most of the 447 molecules were lipids, and enrichment analysis showed that TAGs were the most predictable by wearable data (Supplementary Fig. 8b). HR-related features (for example, HR range, HR maximum and HR s.d.) contributed the most to the predictive models (Supplementary Fig. 8c). Using the random forest model, we then found that several cytokines (C-peptide, GIP, insulin and PP) could also be predicted by wearable data. The most contributed wearable features were CGM and HR-related features (Supplementary Fig. 8d). All those results demonstrate that wearable data could predict our high-frequency multi-omics data from microsamples.
Biochemical changes in the body can occur on the order of minutes and hours51, and thus low-frequency multi-omics data (weekly or monthly) can find some associations with physiological measurements but not causal relationships29,30. Using the high-frequency microsampling approach, we next explored whether we could deduce the potential causal relationships between wearable data and internal molecules through temporal relationships; causal events are expected to precede downstream effects52. We first matched each wearable data point and molecule with different lagged times. Then, the Spearman correlation and P value were calculated for matching time-series data. Only the correlations with similar shapes and lagged time were scored as significant lagged correlations (Methods). To enable this analysis, the laggedCor (lagged correlation) algorithm was developed as an R package (https://jaspershen.github.io/laggedcor/). We then used this algorithm to demonstrate that we could capture and quantify the known lagged correlation and causal relationships between step count and HR. Interestingly, we found a lagged correlation of 0.6 (BH-adjusted P value < 0.0001) with a shift time of −1 min (step count − HR, Supplementary Fig. 9a), which means that 1 min after the step count increases, the HR begins to increase. This expected result demonstrates that our lagged correlation algorithm can capture and quantify potential causal relationships. Next, a lagged correlation network between wearable and internal molecular data was generated (Extended Data Fig. 7a and Supplementary Fig. 9b), including 1,217 nodes (3 wearable data points and 1,214 molecules) and 1,895 edges (Extended Data Fig. 7b and Supplementary Dataset 9), demonstrating a high degree of association between wearable and multi-omics data. An example with the top 100 edges for each pair of wearable and omics data is provided in Extended Data Fig. 7a. Step count and HR have most of the edges (57.3% and 42.6%, respectively) in the lagged correlation network (Extended Data Fig. 7b). We also found that CGM correlates more with cytokines than HR and step count (Supplementary Fig. 9c), indicating that glucose levels strongly correlate with immune responses. This result has been demonstrated by other studies53. In addition, we also observed that step count and HR have many (669) overlapping correlations (Supplementary Fig. 9d), as expected since they have a significant positive correlation.
Interestingly, the immunity-related pathways contained some proteins that negatively correlated with CGM, which was not expected (Supplementary Fig. 9e). This demonstrates the importance of following these responses at the individual level. As expected, we also found that glucagon signalling, oxidative phosphorylation pathways and FFAs positively correlate with CGM (Supplementary Fig. 9f,g). Glucagon breakdown can raise the concentration of glucose and fatty acids in the bloodstream, and oxidative phosphorylation can oxidize nutrients to release chemical energy. We found that the caffeine metabolism pathway positively correlates with HR (Supplementary Fig. 9h), consistent with previous studies54. We also found that the blood coagulation pathway positively correlates with HR (Supplementary 14i), and the neutrophil degranulation pathway negatively correlates with HR (Supplementary Fig. 9j). To the best of our knowledge, these associations provide new biological insights that should be validated in future studies. Overview, these results demonstrate that the wearable data can reflect the physiological status of the participant and reveal useful insights at a personal level.
We extracted the CGM glucose subnetwork from the entire lagged correlation network to further explore how glucose associates with internal molecules (Fig. 6a). We observed that CGM glucose has a significant lagged correlation with α-synuclein (lagged correlation: 0.36, BH-adjusted P value < 0.05) (Fig. 6b), and the shift time is −55 min (α-synuclein − CGM), indicating that α-synuclein may directly or indirectly upregulate glucose levels in the blood. This result has been demonstrated by previous studies55,56. Previous studies have shown that higher C-peptide levels correlate with increased CGM glucose values57. Our data found that CGM glucose significantly lagged correlations with C-peptide (Fig. 6b and Supplementary Fig. 10a) and insulin (Supplementary Fig. 10b). The shift time between CGM and C-peptide in this individual is 10 min (lagged correlation 0.36, BH-adjusted P values < 0.05), which means that CGM glucose precedes the concentration of C-peptide in blood by 10 min. We also observed that CGM significantly correlates with several cytokines, including TNF-β (Fig. 6b), FLT3L, IL15, IP10 and TNF-α (Supplementary Fig. 10c; time shift 0 min to 15 min), and four of them are pro-inflammatory cytokines. These results indicate that glucose can cause a rapid and specific pro-inflammatory response. In summary, our results show that, on the basis of the high-frequency multi-omics data from microsamples, we find potential causal associations between wearable and multi-omics data. The potential causal relationships we found using the laggedCor algorithm can be validated by future experiments.
Fig. 6: CGM and internal molecule causal association network.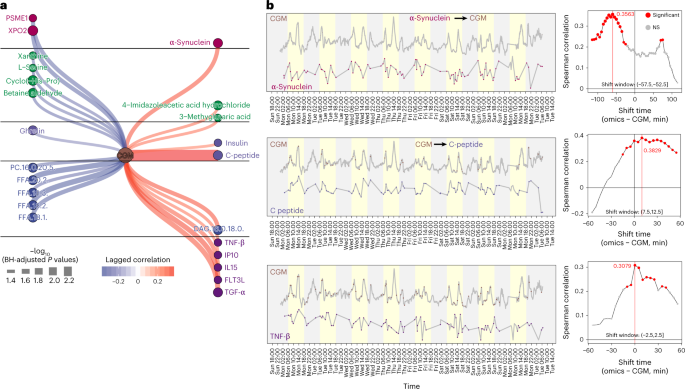
a, The CGM glucose subnetwork from the whole network. b, Three examples are shown to represent the causal relationships between CGM glucose and internal molecules. NS, not significant.
Source data
Source: news.google.com