Large-scale incorporation of barcodes avoids artificial bottlenecking of variants
Naturally occurring genetic diversity in influenza virus populations is poorly suited for high-resolution characterization of population-level dynamics and cannot accurately enumerate the full spectrum of individual virions present. Many virions will not have genetically unique markers and genetic mutations may affect the fitness of the virus, biasing the representation of specific variants in the population and precluding their use as a neutral marker. To better resolve and quantify the dynamics of the IAV population, we introduced dual molecular barcodes into the genome of the influenza virus isolate A/California/07/2009 (H1N1; CA07) to create individual viruses that are uniquely recognizable and quantifiable via deep sequencing (Fig. 1a). Barcodes of 10 randomized nucleotides were introduced onto the HA and PA segments that were subsequently used for high-efficiency virus rescue (Fig. 1b). HA is under selective pressure as the viral attachment protein and the principal target of neutralizing antibodies. We might therefore expect barcodes embedded in HA to increase or decrease in frequency as a result of selection on HA that allows hitchhiking of the linked barcode. Conversely, PA is subject to less intense selection pressure, and barcodes on this segment may be expected to better represent the total population size. For both HA and PA, barcodes were encoded between the ORF and the UTR. Packaging and bundling signals were duplicated downstream of the barcode to ensure proper gene replication and virion formation22,23,24. This strategy parallels prior work where small-scale barcoded libraries were successfully used to quantify transmission bottlenecks17. The utility of the system was further increased by using the PA reporter construct that co-transcriptionally expresses Nanoluciferase (PASTN)22. Finally, the HA segment encodes an additional “registration mark,” six nucleotides creating either NheI or PstI restriction sites, that allows us to index and identify separate libraries of HA variants.
Fig. 1: Creation of molecularly barcoded influenza A virus populations.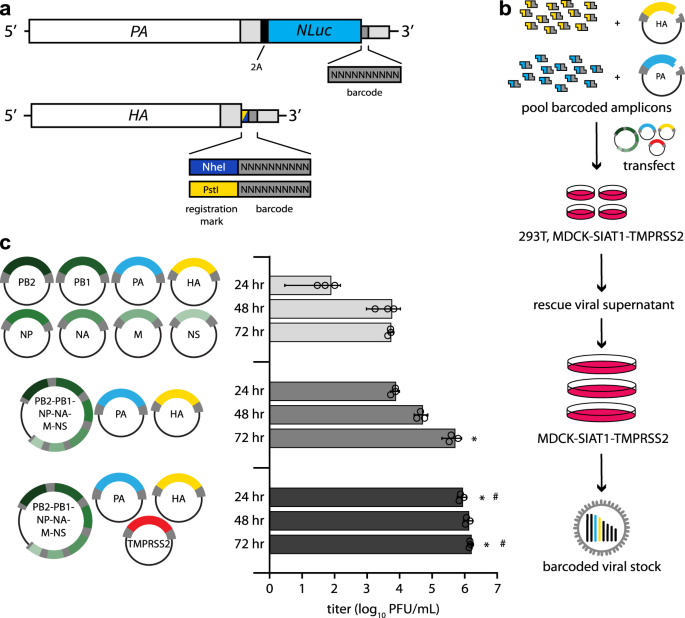
a Molecular barcodes containing 10 randomized nucleotides were encoded downstream of the open reading frame in the PA and HA genes, shown as cRNAs. A registration mark was also added to HA to distinguish unique barcode libraries. Sequences were repeated downstream of the barcode to maintain contiguous packaging signals required for replication, and silent mutations were introduced into the open reading frame to avoid direct repeats. b Experimental overview where randomized barcodes were cloned into reverse genetics vectors followed by large-scale, parallel virus rescues to ensure unbiased barcode distribution. c Optimized rescue plasmids enhance viral yield. Rescue efficiency was determined by measuring viral titers at the indicated times post-transfection with the standard 8-plasmid system, a consolidated 3-plasmid system, or the 3-plasmid system plus a vector expressing TMPRSS2. (data presented as the mean of n = 3 ± sd. ANOVA with Tukey’s post hoc, *p < 0.05 relative to 8-plasmid rescue, #p < 0.05 relative to three-plasmid system.) Source data are provided as a Source Data file.
The limited efficiency of virus rescue can introduce artificial bottlenecks25. To increase efficiency and recover a larger, more diverse barcode population, we reduced the number of individual plasmids needed for virus rescue26. We combined the 6 non-barcoded segments of CA07 IAV onto a single plasmid, reducing the entire reverse genetics system from 8 to 3 plasmids (Fig. 1c). Rescue titers of the 3-plasmid system increased >200-fold compared to the 8-plasmid system. Titers were further increased by co-expressing transmembrane protease serine 2 (TMPRSS2) during virus rescue, which cleaves and activates HA. We performed 120 parallel virus rescues, pooled the resultant supernatants, and passaged them at high representation to ensure unbiased barcode distribution (Fig. 1b). NheI and PstI registration marked libraries were prepared independently.
Viral barcodes reveal selective sweeps in vitro
Deep sequencing revealed ~180,000 unique PA barcodes and over 238,000 HA barcodes in each of our original virus libraries (Fig. 2a). Given that each library has an invariant registration mark, we could measure the fidelity of the quantification pipeline by assessing the number of reads that do not match the predicted registration mark sequence. Over 99% of mapped reads perfectly matched the appropriate registration marks on HA, with the majority of those that did not match differing by a single nucleotide from the intended registration mark, indicating the neutrality of the registration mark sequence and overall high fidelity of our sequencing pipeline. Sequencing errors may create the appearance of unique barcodes, artificially inflating our diversity metrics. To minimize this possibility, we performed clustering on aligned sequences that created networks connecting a parental barcode with mutational derivatives27. All reads in the cluster were then assigned to the parental barcode before quantitation.
Fig. 2: Single viruses seed selective sweeps in HA.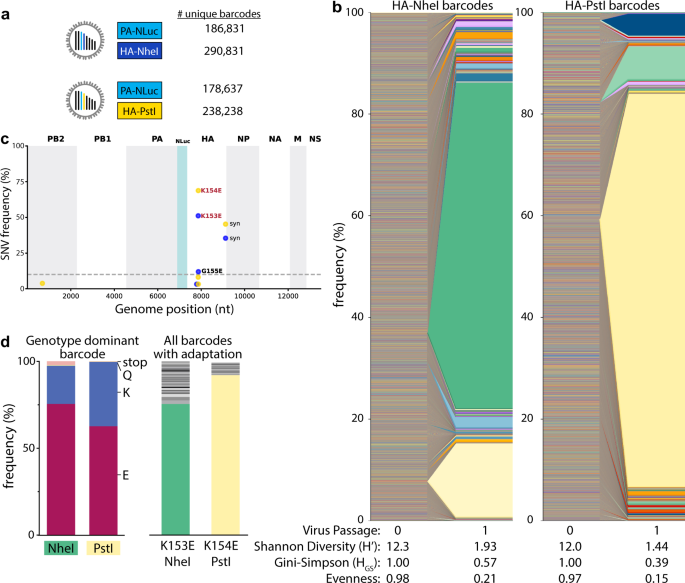
a Creation of two dual-barcode libraries with distinct registration marks and uniquely addressable members. b Frequency of each lineage as a fraction of total population size. Colors indicate unique barcode identities. c Whole-genome sequencing identifies adaptive variants in HA. Individual single nucleotide variant (SNV) frequencies are indicated at each nucleotide position in a concatenated IAV genome for each library. d Long-read sequencing reveals selective sweeps by linking adaptive mutants in HA to single dominant barcodes. The frequencies of mutations coding for the indicated change that is linked to the dominant barcode are shown for both libraries (left). The actual frequency of K > Q and K > stop mutants versus the contribution from long-read sequencing errors to their appearance is unknown. The frequencies of all barcodes linked to the adaptive glutamic acid variant are indicated (right), with the dominant barcode in each library colored as in b. Source data are provided as a Source Data file.
Viral populations were characterized by: richness, the total number of unique lineages present; Shannon’s diversity and the Gini-Simpson index, metrics that consider both the presence and relative abundance of a lineage; and, evenness, a parameter that compares the frequencies of all lineages in the population to that of a theoretically evenly distributed population28,29,30. Shannon’s diversity is more influenced by richness where very rare lineages have large effects, whereas the Gini-Simpson gives more weight to dominant lineages and is thus influenced more by evenness31. To account for the possibility that the underlying structure and size of our populations may bias their diversity assessments, we report both. Barcode enumeration for viruses recovered from the transfected cell supernatant (i.e., passage 0, P0) revealed rich and highly diverse populations with evenly distributed lineages (Fig. 2a, b). However, a single passage at an MOI ~0.01 with a total of ~106 virions to create amplified P1 stocks resulted in highly skewed populations in which individual lineages dominated the population, evidenced by dramatic drops in Shannon’s diversity and evenness (Fig. 2b). The dominant barcodes in each library represented 64–77% of the population. Neither of these barcodes was dramatically over-represented in the plasmid or P0 stocks. In fact, the most abundant lineages in the P0 rescue stocks did not become the most prevalent in our amplified stocks.
Changes in population composition can occur through drift or selection. We passaged the virus at a large effective population size, minimizing the propensity for drift and raising the possibility that the expanding lineages became dominant because they had acquired a selective advantage. Whole-genome sequencing of the P1 stocks identified the single nucleotide variants (SNVs) A540G (numbering based on cRNA) in almost 50% of reads from NheI registration mark viruses and A543G in almost 70% of reads from PstI marked viruses (Fig. 2c), mirroring the abundance of the dominant barcode. These mutations code for HA K153E and K154E (H1 numbering), respectively. Importantly, these changes in HA had previously been identified as adaptations that provide a growth advantage to CA07 in cell culture32. Long-read sequencing showed that the dominant barcode was linked to the adaptive mutations (Fig. 2d, left). 62–75% of reads containing the dominant barcode also encoded the adaptive mutation. Similarly, the adaptive mutation was primarily linked to the dominant barcode (Fig. 2d, right). However, up to 24% of reads encoding these adaptive variants were associated with different very-low-frequency viral lineages. These data are consistent with a soft selective sweep where HA A540G or A543G arose on multiple genetic backgrounds, even though only one lineage ultimately became the most abundant, possibly suggesting clonal interference. These observations demonstrate that our barcoded viruses capture lineage dynamics and selective processes at extremely high resolution.
Pre-adaptation creates large and diverse viral libraries
To create diverse libraries without tissue-culture-induced skewing, we made new libraries on a “pre-adapted” HA K153E background. The libraries contained at least 57,000 unique members with high diversity and evenness (Fig. 3a, b). Multicycle growth curves of HA K153E NheI- or PstI-marked barcoded viruses were indistinguishable (Fig. 3c). Insertion of the barcode cassette and the PA reporter gene slightly reduces titers when compared to HA K153E alone, consistent with prior results22,33. The vast majority of lineages were present at low frequency, and no single lineage in our amplified stocks was present at a frequency above 0.6% for HA, or above 1.2% for PA barcodes (Fig. 3d). We utilized the HA-NheI stock for extensive quality control of our barcode enumeration pipeline. Libraries were prepared from four independent RNA extractions and sequenced. Lineage frequencies from the four replicates showed a strong correlation (Supp. Fig. 1A). There was a high degree of overlap between replicate runs, with sequences present in all four replicates accounting for over 93% of all read counts (Supp. Fig. 1B). Yet, when read counts for identical sequences were collapsed to their corresponding barcode, only ~37% of barcodes were identified in all replicate runs (Supp. Fig. 1C). This apparent discrepancy is due to variable detection of extremely low-frequency lineages. The frequency of an individual lineage was correlated with the number of replicates in which it was detected (Supp. Fig. 1D). Rarefaction-extrapolation curves for each replicate overlapped, indicating reproducible sampling (Supp. Fig. 1E). However, they also suggest that our sampling has not reached saturation and that some low-frequency lineages may not be detected. Further, when compared to the simulated sampling of a population with evenly distributed barcodes, our replicates diverged from the ideal population. This is consistent with the presence of extremely low-frequency lineages. These data highlight the complexity of our viral populations, our ability to reliably detect individual members, and the inherent limitations of this approach. Replicate sequencing of the PA barcode and the HA-PstI stock produced similarly well-correlated results (Supp. Figs. 1F, 2A–C). No additional SNVs were detected at high frequency in our libraries, while K153E remained fixed (Fig. 3e).
Fig. 3: Generation of large and evenly distributed dual-barcoded virus libraries.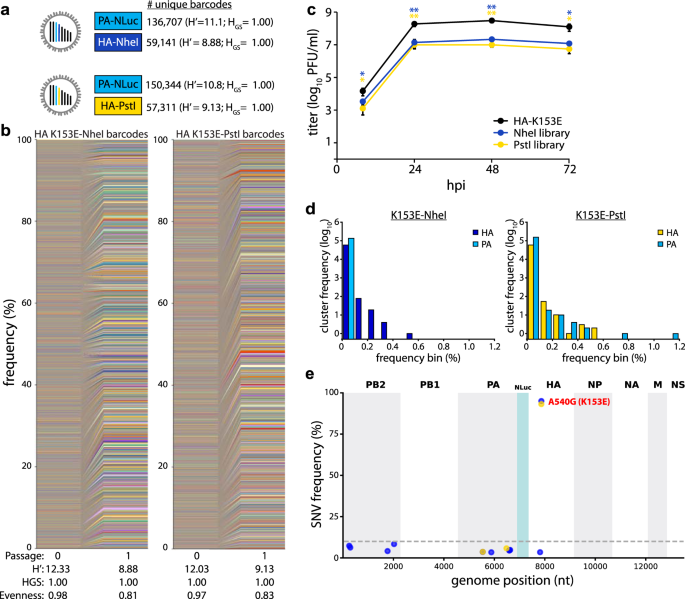
a, b Properties of the A/CA/07/2009 HA-K153E PASTN virus libraries. Data are from a single sequencing replicate; see Supplemental Figs. 1, 2 for additional analyses. c Multistep growth curves of dual-barcoded PASTN libraries compared to the parental strain A/CA/07/2009 HA-K153E. Viral titer was measured by plaque assay (mean of n = 3 ± sd, two-way ANOVA with Tukey’s post hoc, *p < 0.05 and **p < 0.01 compared to the parental). d Frequency distribution of unique barcodes on HA and PA binned in 0.1% increments. e Whole-genome sequencing was performed on amplified viral stocks and SNV frequencies are indicated at each nucleotide position for each library. Source data are provided as a Source Data file.
Rich and diverse populations replicate in mice
The dual barcoded virus libraries provide a key opportunity to quantify population dynamics in vivo. Mice are frequent models for influenza virus replication, pathogenesis, and immune response34. Mice were inoculated with the CA07 PASTN-barcoded virus libraries containing either barcoded HA-K153E populations or a non-barcoded HA-K153E control. Weight loss was similar for all conditions (Fig. 4a), and viral titers in the lungs were not significantly different at either 3 or 6 dpi (Fig. 4b). Thus, the introduction of barcodes onto HA does not compromise replication in vivo.
Fig. 4: Replication of diverse virus populations in mice.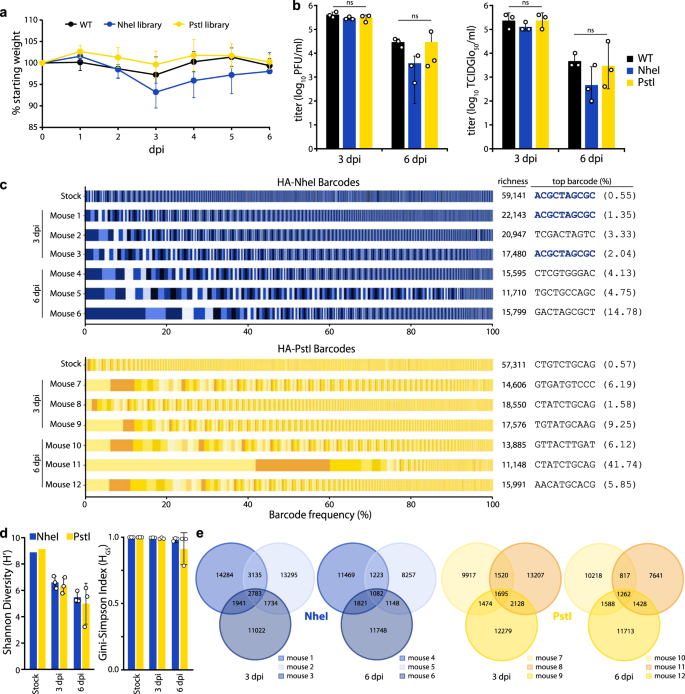
a Mice were inoculated with 105 TCIDGlo50 of virus-containing barcoded PASTN with either HA-K153E or barcoded variants and body weights were measured daily. Half of the mice were killed at 3 dpi. Data presented as mean ± sd for n = 6 1–3 dpi, and n = 3 for 4–6 dpi. b Viral titers in mouse lungs harvested at 3 and 6 dpi were determined by plaque assay (left) or TCIDGlo50/mL (right). Data presented as the mean of n = 3 ± sd and analyzed by one-way ANOVA. n.s. = not significant. c Barcodes in the viral stock and mouse lungs were quantified and the frequency of clustered HA barcodes as a fraction of total population size is indicated. Each color in a series represents an individual barcode cluster. A total number of unique barcode clusters per sample and the most abundant barcode with its frequency is listed on right. d Shannon’s diversity index (left) and Gini–Simpson index (right) for viral populations in the stock and mouse lungs (mean of n = 3 ± sd). e Venn diagrams displaying the number of unique and shared lineages within each mouse for NheI and PstI libraries. Source data are provided as a Source Data file.
Deep sequencing of mouse lung homogenates revealed that the majority of mice harbored diverse viral lineages (Fig. 4c, d). Mouse infections were characterized by a high richness, where approximately one-third of lineages present in the stock were detected in the lungs at 3 dpi. The frequency of lineages in the NheI-marked stock was moderately predictive of their abundance in the mouse at 3 dpi (Pearson’s R > 0.57) (Supp. Fig. 3A). For example, the most abundant lineage in the HA-NheI stock was also the most abundant lineage in two mice at 3 dpi (Fig. 4c, Supp. Fig. 3A). However, there are notable exceptions in which low-frequency lineages in the stock rose to high relative abundance in the mouse (Supp. Fig. 3A). In addition, we cannot exclude the possibility that some of our barcodes are derived from residual viruses from the inoculum that did not initiate a productive infection. Mice infected with PstI-marked libraries showed less correlation between the inoculum and lungs at 3dpi (Supp. Fig. 3A). For all viral libraries, the titers decreased from 3 to 6 dpi, as did richness and overall diversity (Fig. 4c, d). In an extreme example, a single lineage in mouse 11 rose to over 40% prevalence at 6 dpi (Fig. 4C, Supp. Fig. 3B). The correlation between lineage frequency in the stock and the mouse lung was greatly diminished at 6 dpi (Supp. Fig. 3). The lineage identities are highly heterogeneous among mice, with a small fraction shared across animals, suggesting that barcodes themselves are not under selection in vivo (Fig. 4e). Together, these data show virus populations replicating in mice approximate the diversity present in the inoculum, as might be expected from a high-dose challenge. Within-host richness decreases as the infection are resolved, with lineages lost as the overall population size decreases.
Seeding and localized replication dynamics result in the compartmentalization of viral lineages in the ferret lower respiratory tract
Ferrets are often considered the “gold standard” infection model with lung physiology, sialic acid distribution, pathogenesis, and transmission capacity that are all similar to humans35,36. We intranasally inoculated 3 ferrets with the HA-K153E dual barcoded library containing the NheI registration mark. We used a site-specific inoculation strategy in which the inoculum is retained in the upper respiratory tract without unintentional introduction into the trachea or lower respiratory tract37, allowing us to track the natural movement of the virus. Ferrets were monitored daily for signs of infection with nasal washes obtained 1, 3, and 5 dpi. Ferrets exhibited slight weight loss over the course of infection (Fig. 5a), consistent with prior work33. Similarly, we detected high viral titers in nasal washes 1 dpi that declined over time (Fig. 5b).
Fig. 5: Population diversity is reduced when the influenza virus moves from the upper to the lower respiratory tract in ferrets.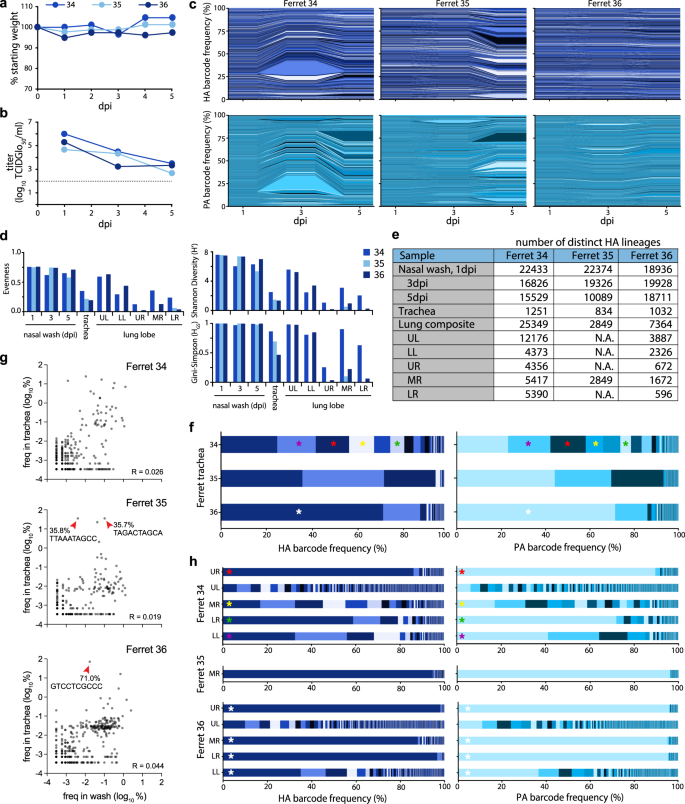
a Ferrets were inoculated with a site-specific intranasal dose of 105 PFU of dual-barcoded A/CA/07/2009 HA-K153E PASTN virus containing the NheI registration mark. Ferret weight was monitored daily. b Viral titer in ferret nasal washes were determined by TCIDGlo50. c Changes in frequency for HA (top) and PA (bottom) barcodes present in nasal wash samples over the course of infection. d Evenness, Shannon’s diversity index, and Gini-Simpson index for the indicated viral populations. e The richness of each tissue is indicated by the number of distinct barcodes in each sample. N.A. = not attempted. f Virus was recovered from the trachea at 5 dpi and the frequency of barcodes was determined. Distinct dominant barcodes are identified by colored asterisks. g HA barcode frequencies were compared between the nasal wash (3 dpi) and trachea (5 dpi) for ferret 34, 35, and 36. Red arrowheads highlight dominant barcodes with frequency > 30%. R = Pearson’s correlation coefficient. Note that barcodes unique to the nasal wash or trachea are not plotted here. h Virus was recovered from lung lobes 5 dpi and the frequency of barcodes was determined. Lung lobes: upper left (UL), lower left (LL), upper right (UR), middle right (MR), lower right (LR). Distinct dominant barcodes are identified by colored asterisks, matching those in g where appropriate. The limit of detection for viral titer assays is indicated by a dashed line in b. Source data are provided as a Source Data file.
Sequencing revealed rich and complex viral populations in the nasal washes of ferrets, consistent with a high dose inoculation in this compartment (Fig. 5c–e). Frequency trajectory plots showed heterogeneous and well-mixed viral populations undergoing little if any, selection or bottlenecks in the upper respiratory tract (Fig. 5c). This is consistent with a highly diverse population with generally even lineage distribution, reflected by high Shannon’s diversity and Gini-Simpson indices and evenness (Fig. 5d). Approximately 19,000–22,400 unique lineages were detected in each nasal wash at 1 dpi, and richness remained high over time, with at least 16,800 lineages at 3 dpi and 10,000 lineages at 5 dpi (Fig. 5e). Sequencing of the barcode on PA revealed remarkably similar lineage dynamics (Fig. 5c). The observation that frequencies of HA and PA barcodes moved in parallel is perhaps surprising given that these are unlinked genes and that influenza viruses can undergo frequent reassortment38.
Intranasally inoculated viruses spread throughout the respiratory tract by 5 dpi. Low levels of infectious virus were present in the trachea of ferrets 35 and 36 (Supp. Fig. 4A), whereas deep sequencing detected IAV genetic material in all trachea samples (Fig. 5f, g). Compared to the nasal wash, population richness dropped significantly, with fewer than 1300 lineages present in any of the trachea samples. Lineage distribution differed in the trachea of each animal, ranging from a more diverse population in ferret 34 to a largely homogenous population in ferret 36, in which a single lineage accounted for 71% of the population (Fig. 5f). Because our site-specific inoculation requires virus replication in the upper respiratory tract prior to movement into the trachea or lower respiratory tract, we used lineages present in nasal washes at 3 dpi as a comparator for populations in the trachea and lungs at 5 dpi. Lineage frequency is poorly correlated between nasal washes and the trachea (Fig. 5g). Migration into the trachea is associated with a drastic reduction in richness, a poor correlation with the source, and skewed distribution of the resultant population, indicating that viral population bottlenecks between compartments and founder effects may play a role during the seeding of the trachea from the upper respiratory tract.
The virus also spread to the lungs of infected animals (Fig. 5h, Supp. Fig. 4A, B). Moderate titers were detected in all five lung lobes in ferret 34, even though infectious viral titers in the trachea were below the limit of detection for this animal. Infectious virus was also detected in all lung lobes for ferret 36, but only the middle right lobe for ferret 35. Thus, while the virus must traverse the trachea to access the lungs, the presence of the virus in the trachea 5 dpi was not predictive of the extent of spread in the lungs. Moreover, populations in lung lobes had higher lineage richness than that detected in the trachea at 5 dpi; the vast majority of lineages in the lung were not detected in the trachea (Supp. Fig. 4C). This raises the possibility that population richness in the trachea at 5 dpi shrank significantly from the populations at earlier time points that may have seeded infection in the lung, or that virus can transit through the trachea to directly inoculate the lung.
Lineage analysis revealed heterogeneous populations of barcodes in each of the distinct lobes (Fig. 5h). Over 25,000 lineages were detected across the five lobes in ferret 34. However, each lung lobe of ferret 34 had a different dominant barcode sequence, and when this same barcode was detected in other lung lobes its frequency varied. The only infected lung lobe of ferret 35 had very low viral titers and was dominated by a single lineage reaching ~95% abundance (Fig. 5h, Supp. Fig. 4B). Ferret 36 yielded another outcome, where the same lineage was dominant at a frequency of 35–98% in each lobe except for the upper left. Like ferret 34, the upper left lobe of ferret 36 maintained a richer and more diverse population. For all animals, individual lobes showed reduced diversity and evenness compared to the virus population in the upper respiratory tract (Fig. 5d). In the two animals in which the virus was detected in all lobes, the upper left lobe consistently had the highest richness, diversity, and evenness. These data suggest that anatomical features associated with each lobe, such as tracheal bifurcation patterns or bronchus size37, may affect patterns of virus establishment and replication. The differences in the composition of the populations in each lung lobe were determined. Bray-Curtis dissimilarity assessment revealed a high degree of compartmentalization, in which each lung behaved as a distinct anatomical “island” with a unique population composition (Fig. 6a). Four lobes in ferret 36 showed lower dissimilarity, as they were dominated by the same lineage, yet the non-dominant lineages still contributed unique populations to each lobe. Only 167 lineages were common to all lobes of ferret 34, and only 42 in ferret 36 (Fig. 6b).
Fig. 6: Lung lineage diversity and population bottlenecks are dominated by stochastic pressures.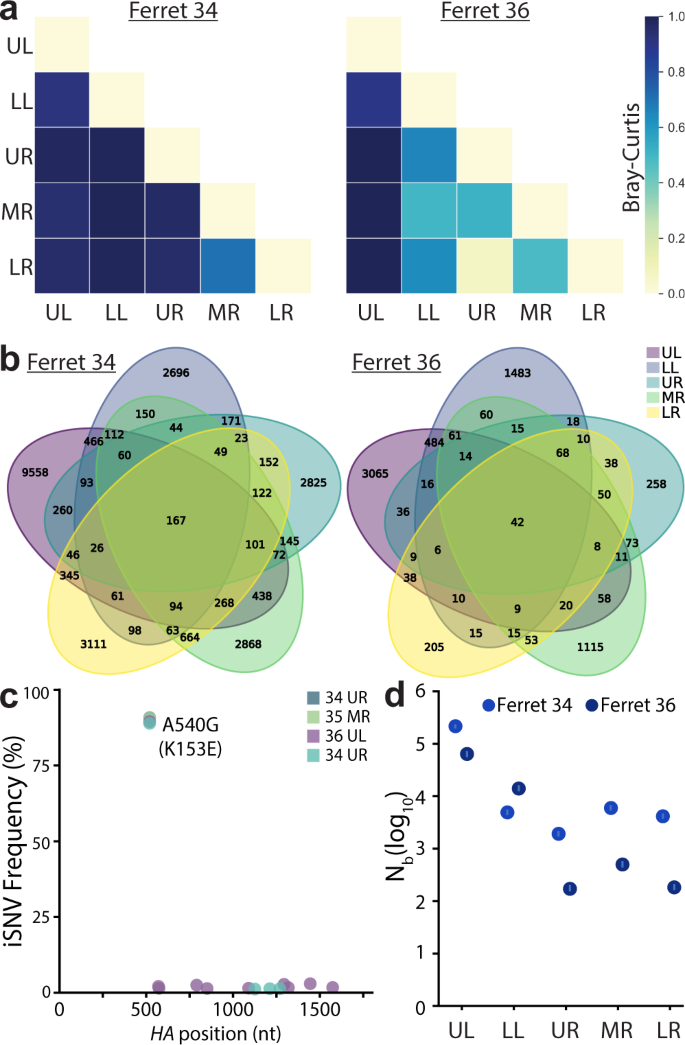
a Pair-wise Bray-Curtis dissimilarity for lung lobes within single animals. b The number of barcode lineages common and unique to lung lobes are illustrated. c Whole-HA sequencing of virus in lung homogenates identified multiple iSNVs, but did not rose above the 3% threshold set for accurate estimation of iSNV frequency. d Transmission bottlenecks (Nb) from nasal wash 3 dpi to each lung lobe at 5 dpi were calculated by maximum likelihood estimation. 95% confidence intervals are shown by the lines within the dots. Source data are provided as a Source Data file.
The drastic reduction in richness and diversity between the upper respiratory tract and the lung lobes suggested populations were subject to selection or bottlenecks. HA sequencing from select lung lobes for each animal revealed that no other intrahost SNVs (iSNVs) surpassed the 3% threshold set for an accurate estimate of iSNV frequency (Fig. 6c). We, therefore, assessed the possibility that viral population bottlenecks were driving the observed reduction in richness and diversity. Note that the limited number of animals inherent in ferret experiments does not provide sufficient power to exclude a contribution of positive selection. We developed a simple multinomial model to estimate bottleneck sizes (Nb) as the virus transmits from the nasal wash at 3 dpi to lung lobes at 5 dpi (Fig. 6d). Specifically, this model estimated Nb using data on the lineages and their frequencies in the 3 dpi nasal wash and on the number of lineages observed in a focal 5 dpi lung lobe. The model yielded maximum likelihood estimates of Nb of ~66,000 (ferret 36) and ~217,000 (ferret 34) virions for the upper left lobe, and lower estimates for the other lobes where maximum likelihood estimates spanned between ~200 and ~15,000 virions (Fig. 6d). These high estimates of Nb are consistent with the detection of a relatively large number of lineages in each of the lung lobes, many of which are observed at only a very low frequency in the 3 dpi nasal wash samples. Furthermore, the larger bottleneck size between the nasal wash and the upper left lobe compared to that for the other lung lobes was consistent with higher levels of viral lineage diversity detected in the upper left lobe compared to the others. Nonetheless, the bottleneck size estimates still appeared unexpectedly large to us, given the drastic reductions in richness and diversity observed in Fig. 5d, e. We, therefore, forward-simulated the multinomial model under the estimated bottleneck sizes, plotting the expected frequencies of the lineages in the 5 dpi lung lobe samples, given their frequencies in the 3 dpi nasal wash samples. These simulations predicted a high degree of similarity between lineage frequencies in the viral populations sampled in the nasal wash and lung lobes, inconsistent with the more disparate lineage frequencies observed (Supp. Fig. 5A). To identify possible reasons for these discrepancies, we modified the multinomial model simulations to incorporate environmental noise; this type of noise would be expected if sites within individual lung lobes were heterogeneous, with some allowing for efficient viral replication while others being less conducive for replication. Simulations of this modified model, parameterized with a substantial amount of lobe heterogeneity (>700-fold replication difference between the 5% and 95% percentiles of the viral population), yielded correlations more similar to those observed between nasal wash and lung lobe lineage frequencies (Supp. Fig. 5B). These results indicate that even though many lineages appear to seed the lung lobes, once in the lobes, replication of viral lineages may be subject to large stochastic effects, reducing viral diversity and evenness.
Considering the lung as a whole for ferrets 34 and 36, a substantial number of lineages were shared between the nasal wash and lung (Fig. 7a). But, this appeared to be largely driven by the rich and diverse population in the upper left lobe, as this overlap was largely lost when lobes were considered individually. Many of the dominant lineages in a lung lobe were poorly represented in the nasal wash, such as that in the upper right lobe of ferret 34 and the dominant lineage shared in 4 lobes of ferret 36 (Fig. 7b, c, Supp. Fig. 6A, C). Lineage enrichment in the lung samples compared to nasal washes revealed many lineages that were unique to nasal washes or lung lobes (Supp. Fig. 6A–C). These data show that treating the lung as a whole can lead to very different and misleading population structures, highlighting the importance of assessing each lobe individually.
Fig. 7: Compartmentalized infections establish replication islands within the lung.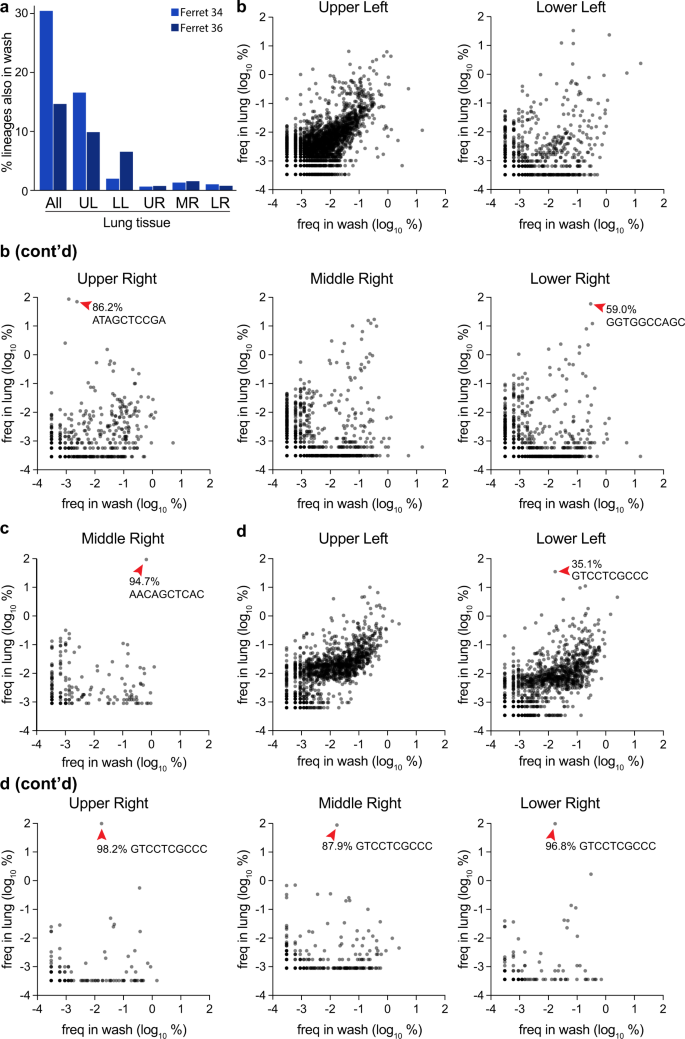
a Overlap between barcodes in the nasal wash 3 dpi and those present in distinct lobes, or composite data for all barcodes in the lung. b–d The frequency of barcodes within the nasal wash is compared to frequencies within individual lobes for b ferret 34, c ferret 35, and d ferret 36. Red arrowheads highlight dominant barcodes with frequency >30%, which for ferret 36 is the same barcode that dominated in multiple lobes of the lung. Note that barcodes unique to the nasal wash or lung are not plotted here and can be found in Supplemental Fig. 6. Source data are provided as a Source Data file.
The same lineage dominated in four lobes of the lung for ferret 36, whereas underlying diversity and a lack of overlap in each population still suggest each lobe is seeded by distinct inoculation events (Figs. 5h, 6b, 7d). In this animal, enrichment for the dominating lineage appeared to occur in the trachea (Figs. 5f, g, 7A). This may be a general trend, as high-frequency lineages in the trachea were often over-represented in the lobes (Supp. Fig. 7A, B). Combined, the large differences in lineage identity and frequency show that each lobe is independently seeded, with little mixing between compartments. Moreover, comparisons across compartments suggest that, while each lobe may receive a large number of viral lineages, stochastic replication dynamics within individual lobes may play a role in substantially reducing the evenness and viral genetic diversity of the seeded lineages.
Source: www.nature.com